LAKANA Sovereign Systems
HomeSystemsArchitectureEvidence / ResultsFiguresPapers / ArtifactsAboutContact
Public Figure Gallery

SOS v71 manuscript figures.

A visual gallery for the LAKANA SOS v71 corrected preprint figure set. These figures summarize simulation-internal survivability, protected-outcome, delivery, detector, degraded-condition, integrity/fail-closed, and sensitivity analyses.

// 01 - SOS v71 figure set

Figures from the corrected SOS v71 preprint bundle

Each image can be opened directly for closer inspection. Captions are preserved in public-safe form for reviewers and partners.

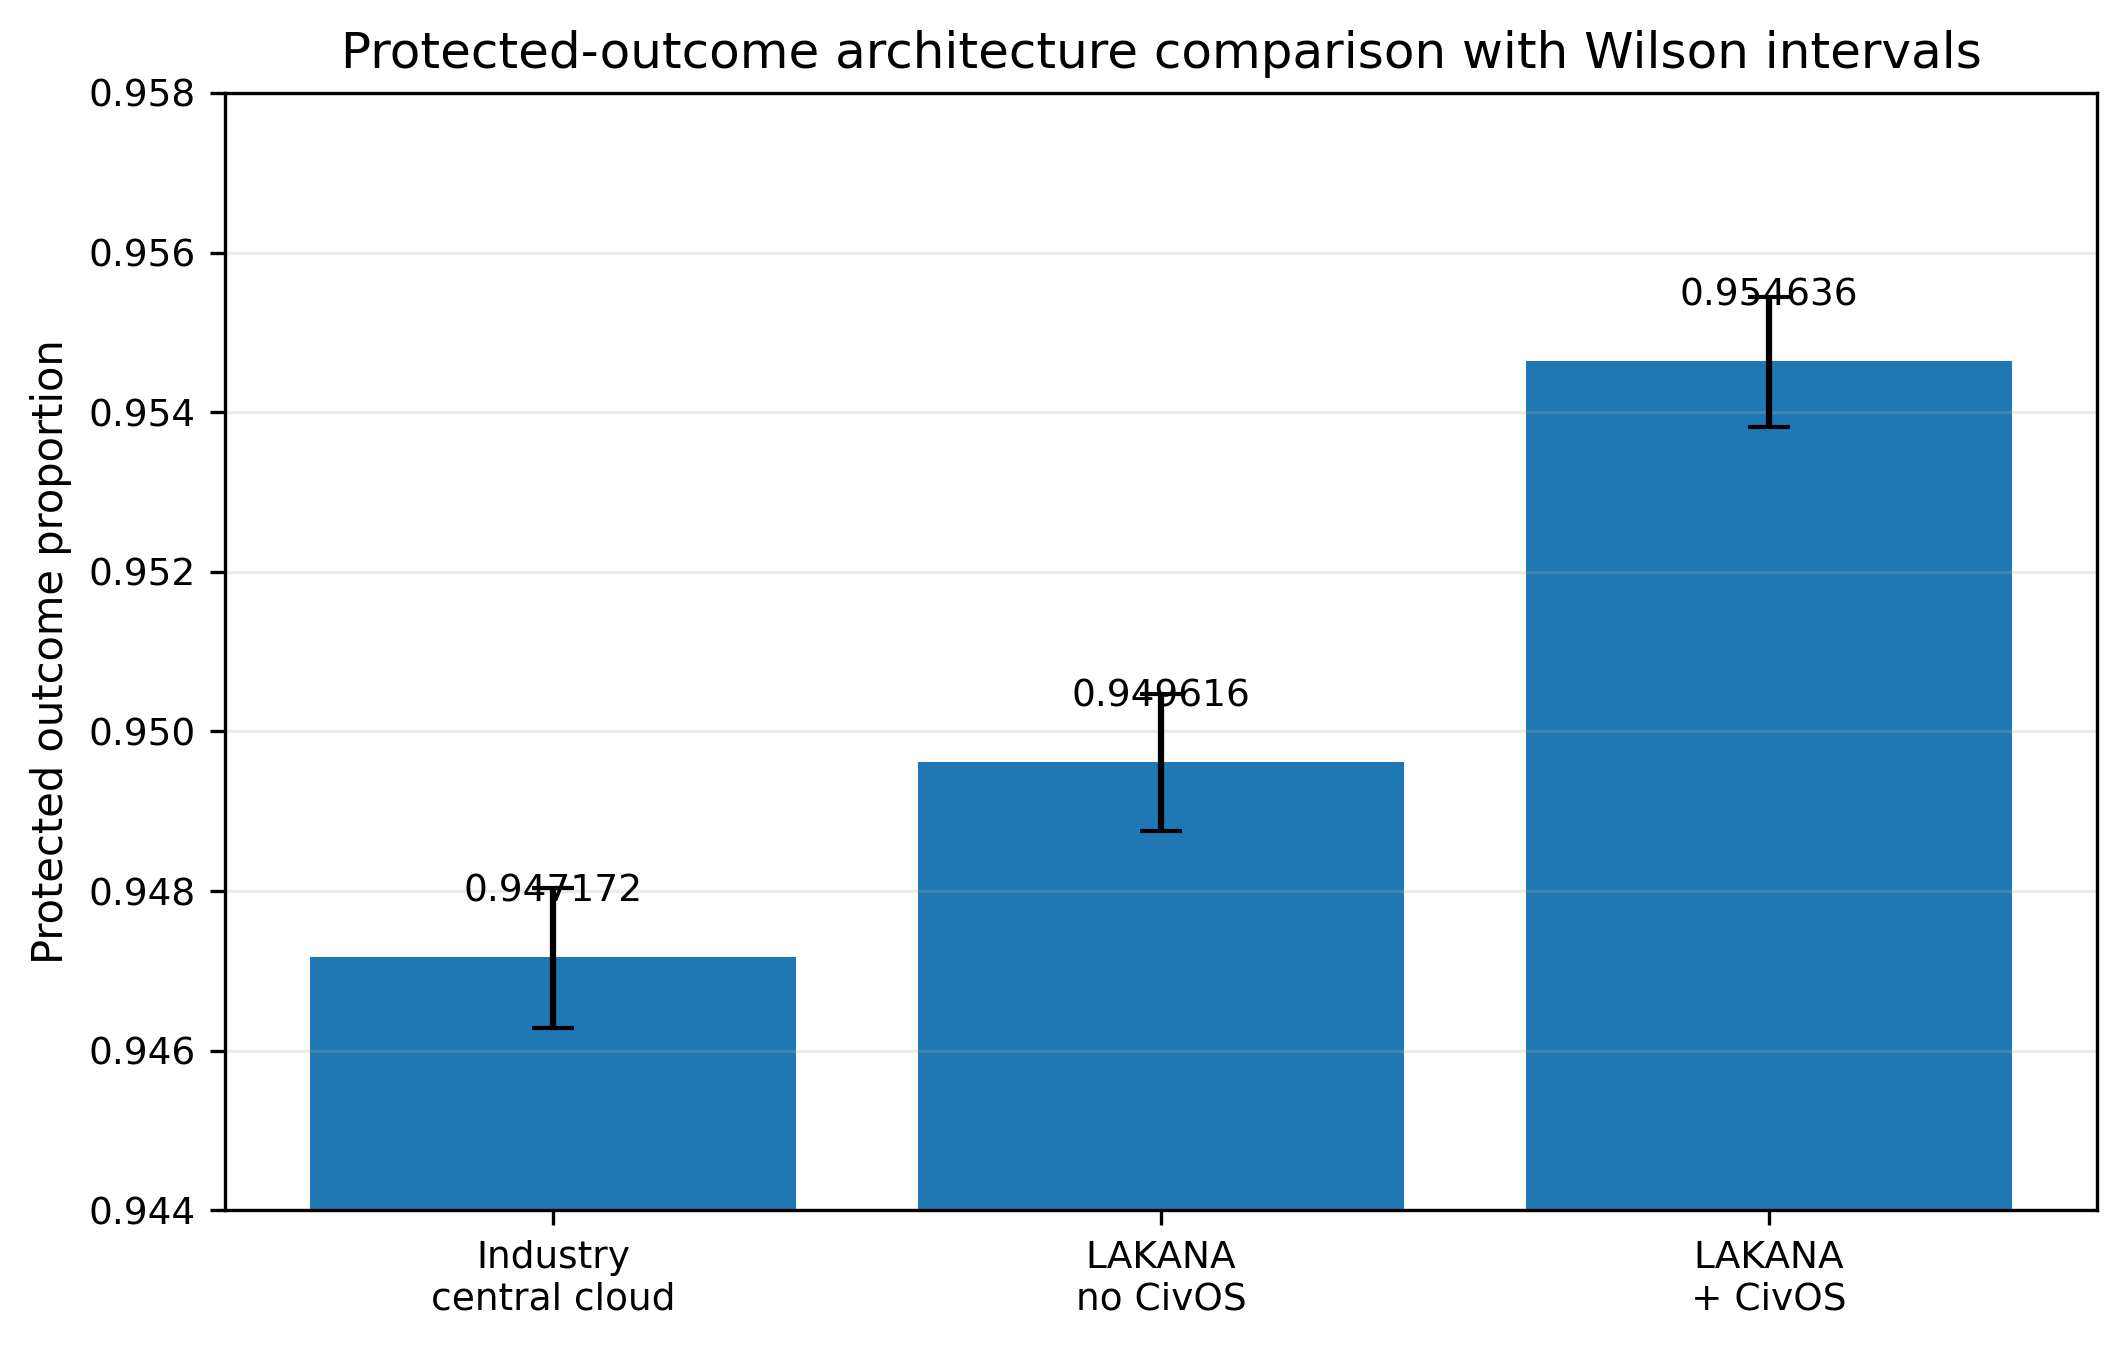
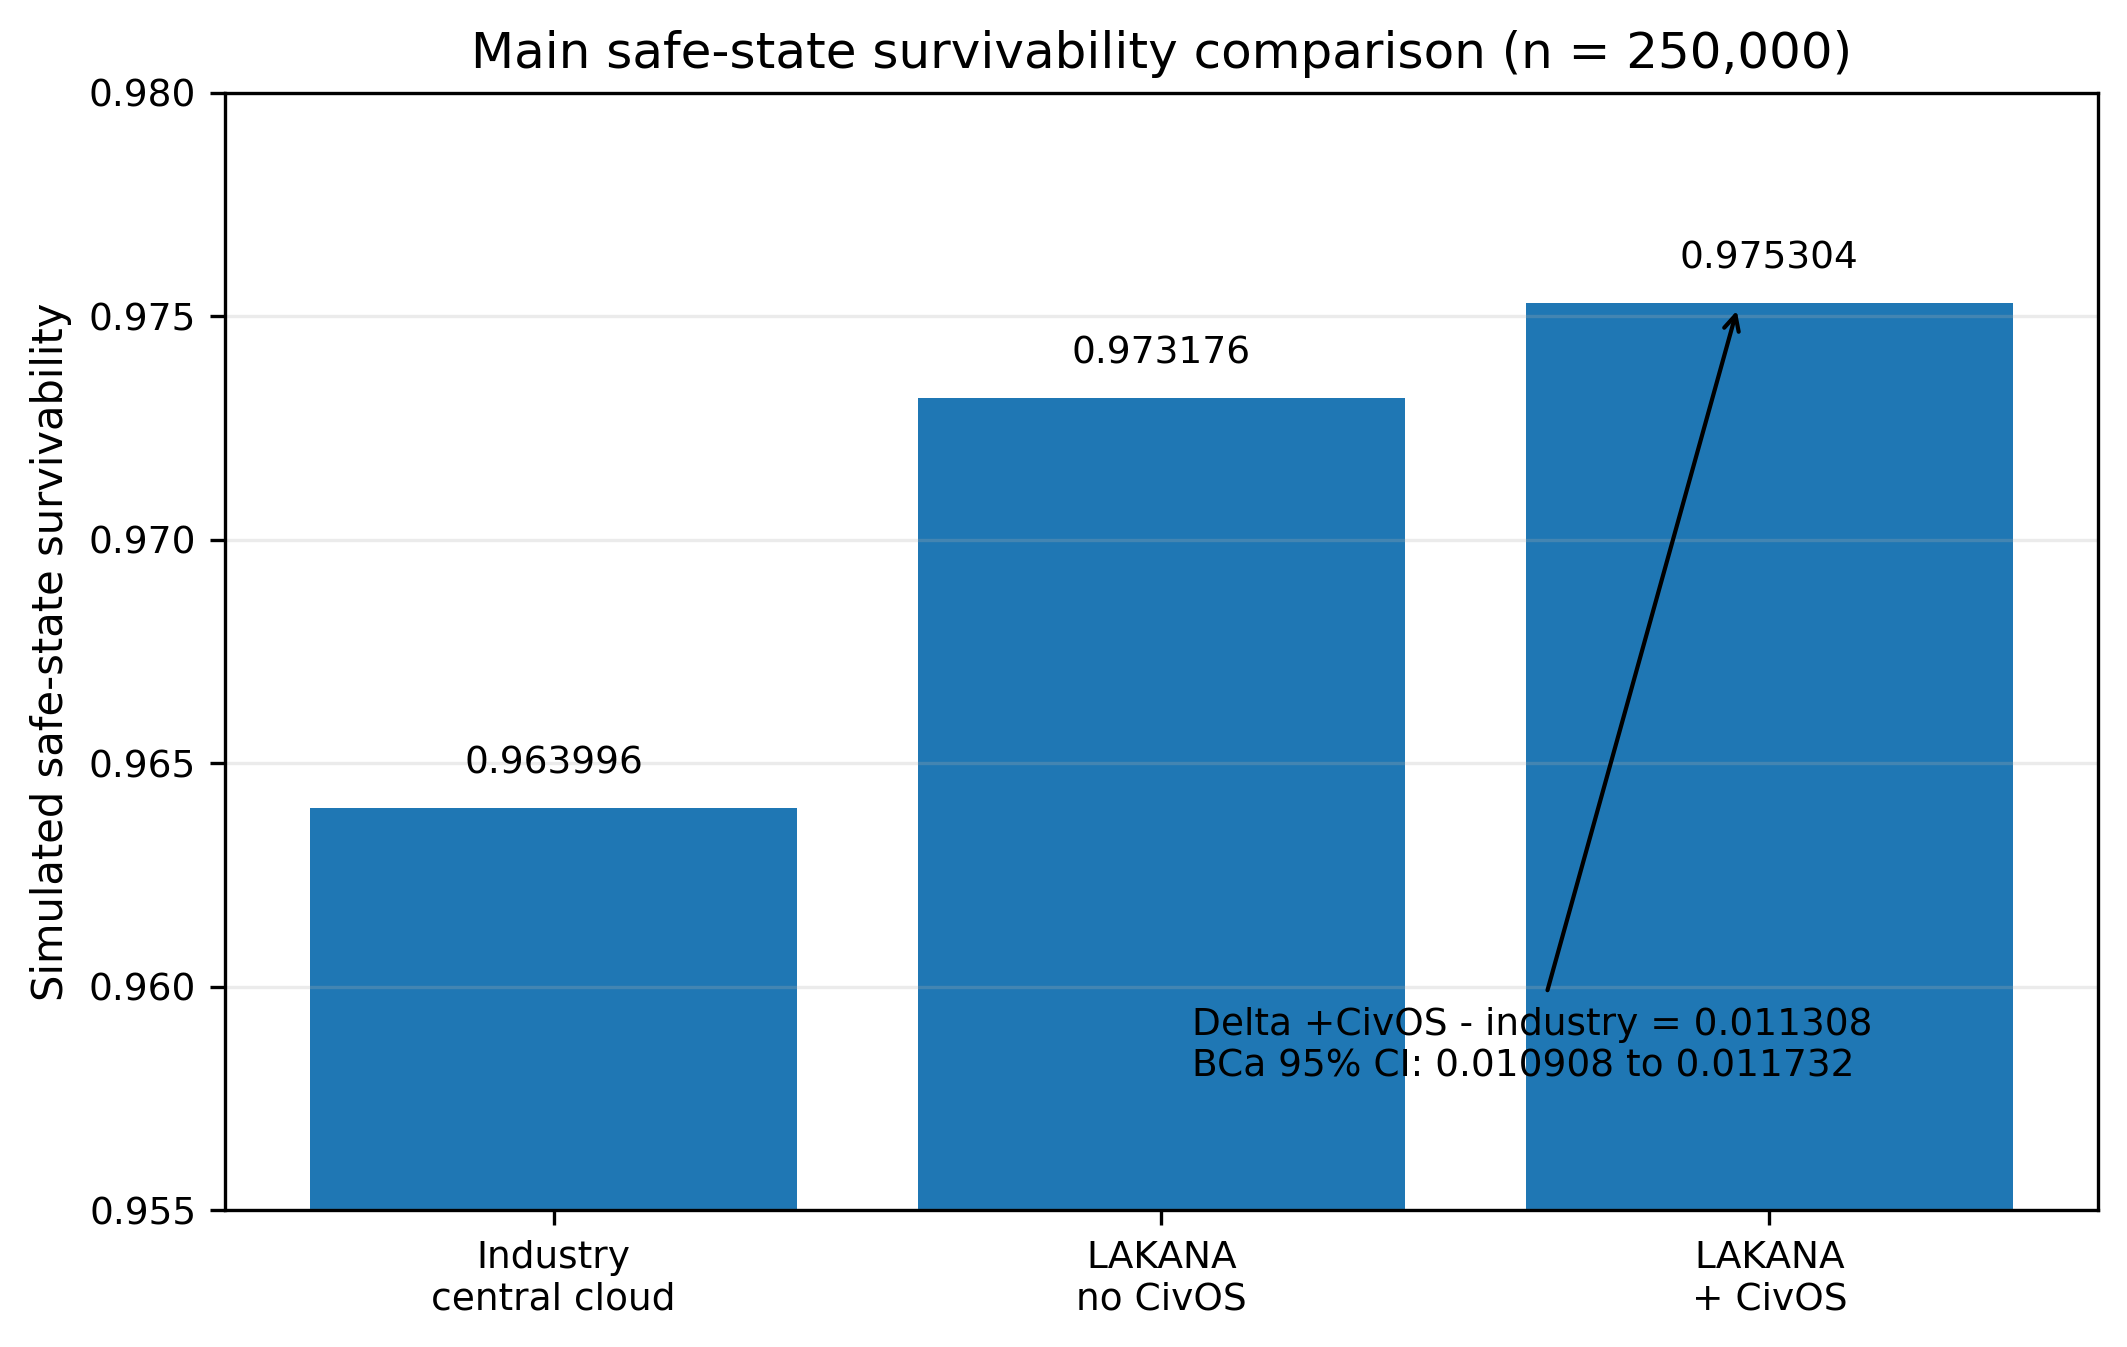
Figure 1 — Safe-State Survivability

Main safe-state survivability comparison (n = 250,000). The simulation-internal survivability metric reports 0.963996 for the industry-style centralized/cloud comparator, 0.973176 for LAKANA without CivOS, and 0.975304 for LAKANA+CivOS. The LAKANA+CivOS minus industry delta is 0.011308 with a bootstrap BCa 95% confidence interval of approximately 0.010908 to 0.011732.

Figure 2 — Protected-Outcome Architecture Comparison

Protected-outcome architecture comparison with 95% Wilson confidence intervals (n = 250,000). LAKANA+CivOS: 0.954636 [0.953813, 0.955445]; LAKANA without CivOS: 0.949616 [0.948752, 0.950467]; industry central/cloud comparator: 0.947172 [0.946288, 0.948042]. This is reported as a separate protected-outcome metric, not as a replacement for the main safe-state survivability estimates.

Figure 3 — Nominal Shared-Detector Delivery Suite

Nominal shared-detector delivery suite (n = 95,000). Detector-side quantities are held constant across architectures. Panel A reports protected outcome. Panel B reports conditional delivery given escalation. Panel C reports conditional survival given escalation. Panel D reports BFB delivery given need. LAKANA+CivOS achieves conditional survival of 1.000 and BFB delivery of 1.000 versus approximately 0.863 and 0.200 for the industry comparator.

Figure 4 — Nominal Detector Tradespace

Nominal detector trade-space under shared transport (n = 85,000). The full TSARO detector reports FPR = 0.047, recall = 0.163, and survivability S = 0.955471. The naive detector reports FPR = 0.086, recall = 0.721, and S = 0.984588. This is a burden-sensitivity trade-space, not a detector-dominance claim: simpler detectors raise recall and survivability in this diagnostic but also impose escalation burden.

Figure 5 — Degraded Delivery Suite

Synthetic degraded-state shared-detector delivery suite (n = 190,000). This stressed architecture comparison holds detector behavior fixed across arms. Under degraded-state stress, the industry-style centralized/cloud comparator's protected outcome falls to approximately 0.783, while LAKANA+CivOS maintains approximately 0.951. BFB delivery given need is 0.136 for the industry comparator versus 1.000 for LAKANA+CivOS. The comparator's dependence on centralized transport is the dominant failure mechanism in this diagnostic.

Figure 6 — Degraded Detector Tradespace

Detector trade-space under synthetic degraded-state stress (n = 170,000). The burden-sensitivity pattern persists under stressed infrastructure. Full detector: FPR = 0.030, recall = 0.113, S = 0.950818. Naive detector: FPR = 0.069, recall = 0.641, S = 0.980667. Shared transport is held fixed; simpler detectors raise recall and survivability while also raising false-positive burden.

Figure 7 — Grouped Degraded Outcomes

Grouped degraded-outcome diagnostic summary. Public-safe grouped diagnostic view for the nominal headline run. Suppression/confirmation accounts for 62.3% (n = 7,067) of grouped degraded-outcome events; threshold-region proximity accounts for 23.6% (n = 2,676); context interference accounts for 13.9% (n = 1,576); integrity/veto accounts for 0.19% (n = 22). Grouped diagnostics make degraded outcomes inspectable without exposing reconstructive internal taxonomy.

Figure 8 — Integrity and Fail-Closed Behavior

Bounded integrity and fail-closed summary. Panel A reports integrity and fallback metrics: evidence integrity rate 0.999884; protected fallback success rate 0.999996; fallback survival given OS compromise 0.995000. Panel B reports compromise and energy proxies on a log scale. These are simulator-internal consistency and fail-closed indicators, not hardware-validated field metrics.

Figure 9 — Sensitivity Summary

Grouped-family Sobol sensitivity indices within the bounded six-parameter analysis box. Detector aggressiveness dominates first-order and total-order sensitivity, with transport degradation as a secondary contributor. OS compromise probability, hardware compromise probability, and initial energy reserve contribute negligibly within the bounded analysis box.

// 02 - claim boundary

Figure interpretation boundary

These figures visualize simulation outputs and architecture-level evidence. They are not clinical validation, field validation, production certification, emergency-response certification, privacy/security certification, or proof of guaranteed real-world effectiveness.