LAKANA Sovereign Systems Physics-first protection without surveillance

Primary

Home Public front door Architecture Authority stack and public safety math Proof Library Manuscripts, artifacts, boundaries, and evidence surfaces Evidence Simulation posture and public research records Contact Research, institutional, and reviewer inquiries

Foundation Layer

CivOS Substrate Base survival layer used across LAKANA models TSARO Deterministic state orchestration NICOLE Custody, lease, handoff, and non-release audit

Live Models

SOS Safety Model Civilian safety, degraded response, and governed responder access SSI Structural Models Athlete and load-bearing worker structural twins W-X / WX-Ag Environmental Models Ground truth, farmer physics, weather/metrology, and node mesh

Specialized Lenses

WX-Ag Farmer Lens Crop, soil, drought, flood, heat, cold, ET₀, and VPD W-X Weather / Metrology Lens Node mesh, drift detection, TTL, IEP, RF noise, and ground-layer truth Responder / BFB Lens Consent-gated rescue access and auditable handoff
LAKANA Sovereign Systems Physics-first protection without surveillance
LAKANA Sovereign Systems
HomeSystemsArchitectureEvidence / ResultsFiguresPapers / ArtifactsAboutContact
Public Figure Gallery

SOS v71 manuscript figures.

A visual gallery for the LAKANA SOS v71 corrected preprint figure set. These figures summarize simulation-internal survivability, protected-outcome, delivery, detector, degraded-condition, integrity/fail-closed, and sensitivity analyses.

// 01 - SOS v71 figure set

Figures from the corrected SOS v71 preprint bundle

Each image can be opened directly for closer inspection. Captions are preserved in public-safe form for reviewers and partners.

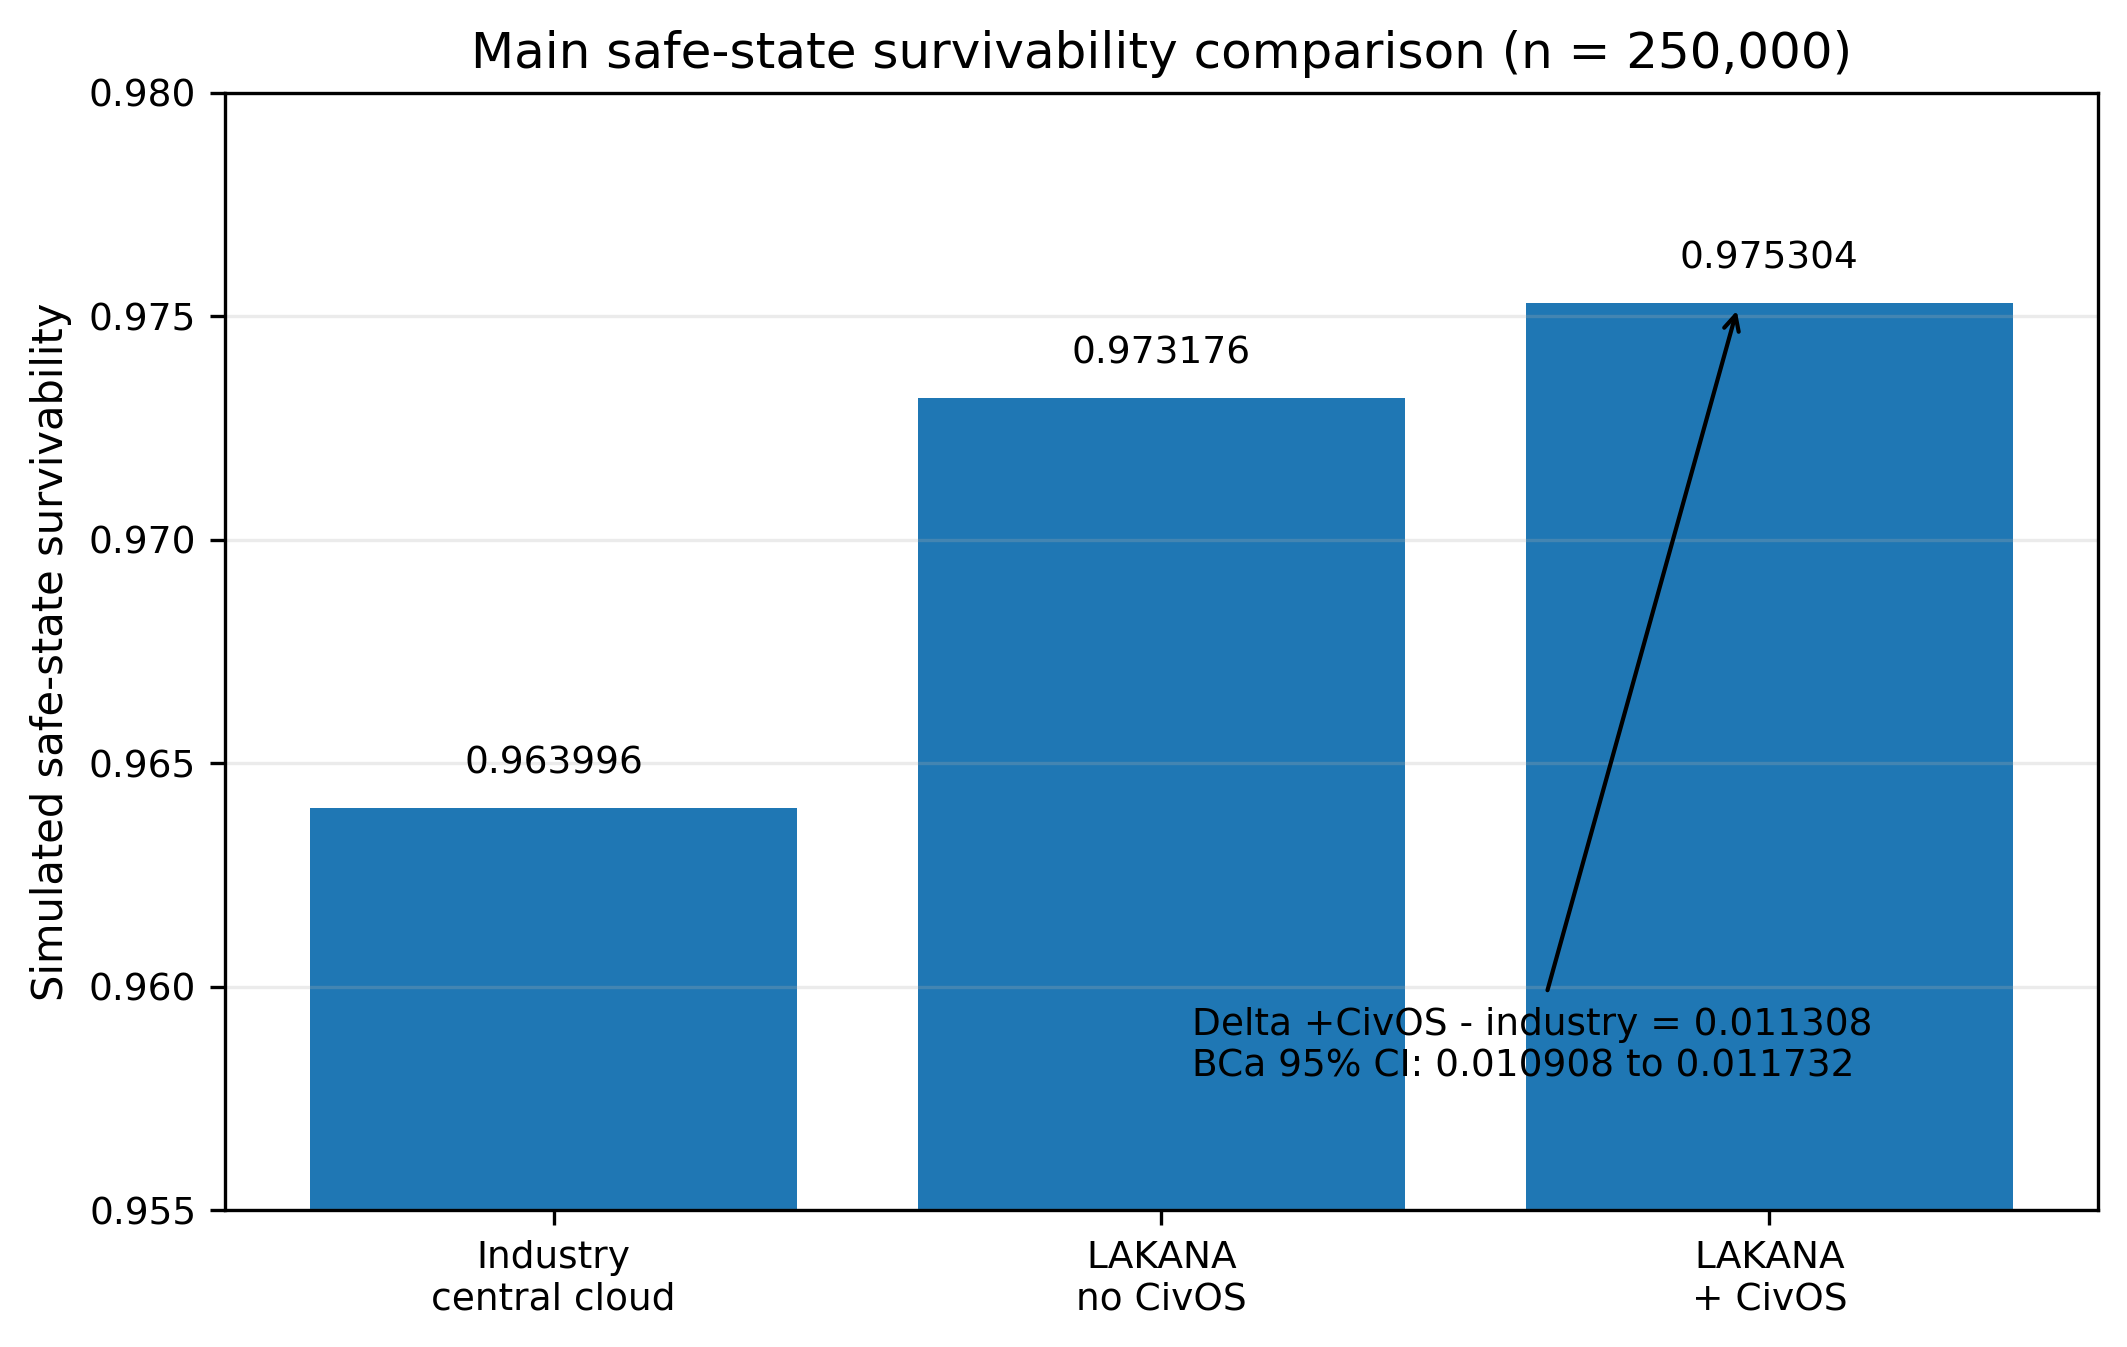
Figure 1 — Safe-State Survivability

Main safe-state survivability comparison (n = 250,000). The simulation-internal survivability metric reports 0.963996 for the industry-style centralized/cloud comparator, 0.973176 for LAKANA without CivOS, and 0.975304 for LAKANA+CivOS. The LAKANA+CivOS minus industry delta is 0.011308 with a bootstrap BCa 95% confidence interval of approximately 0.010908 to 0.011732.
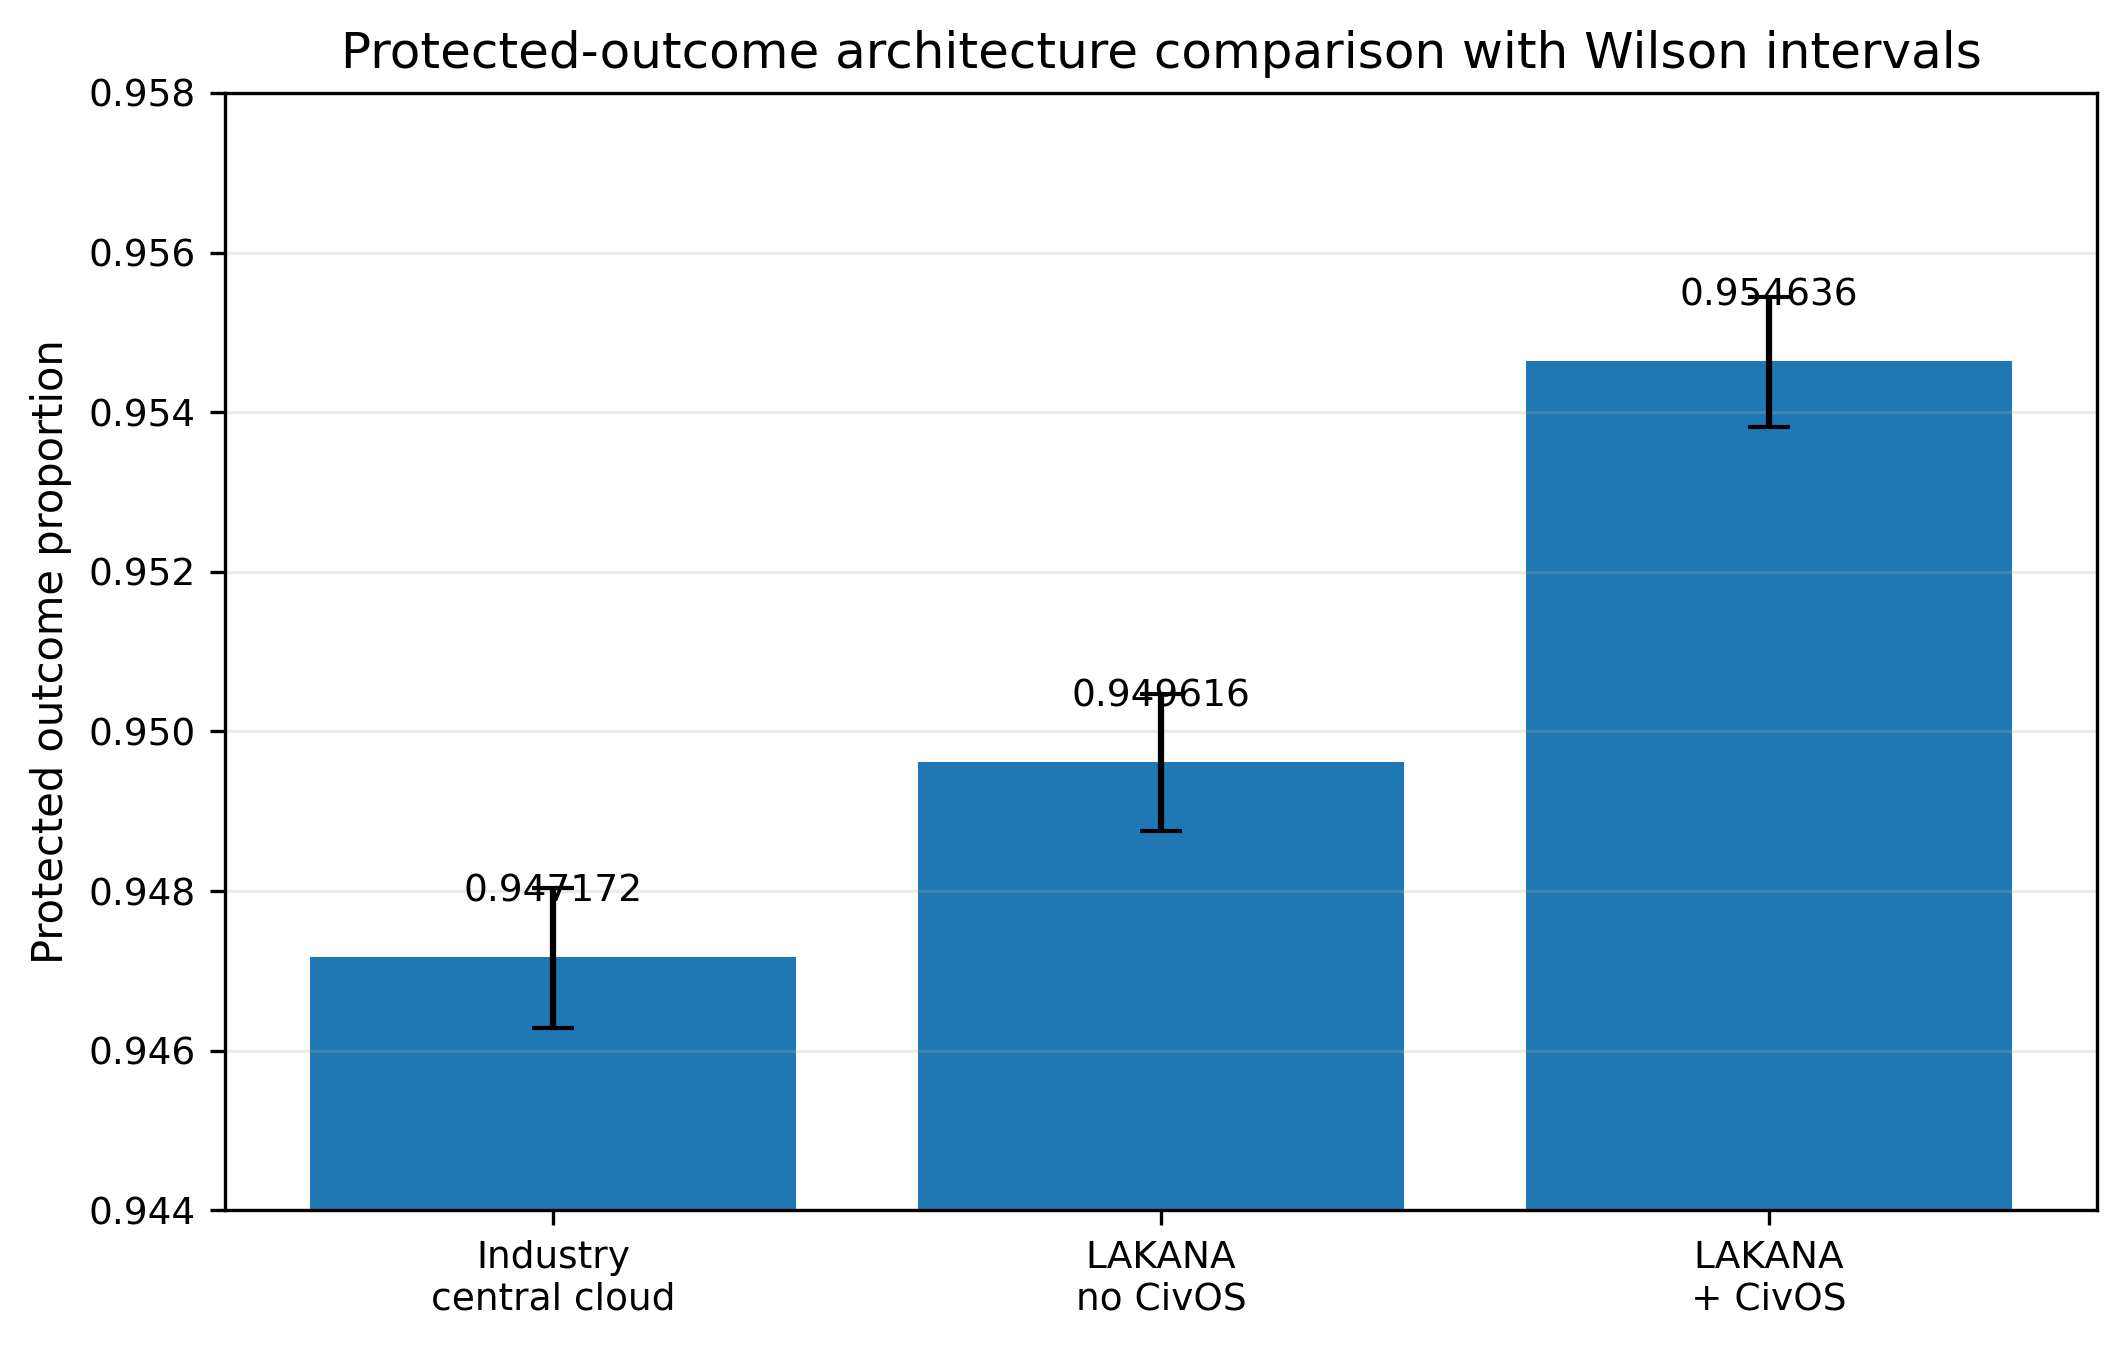
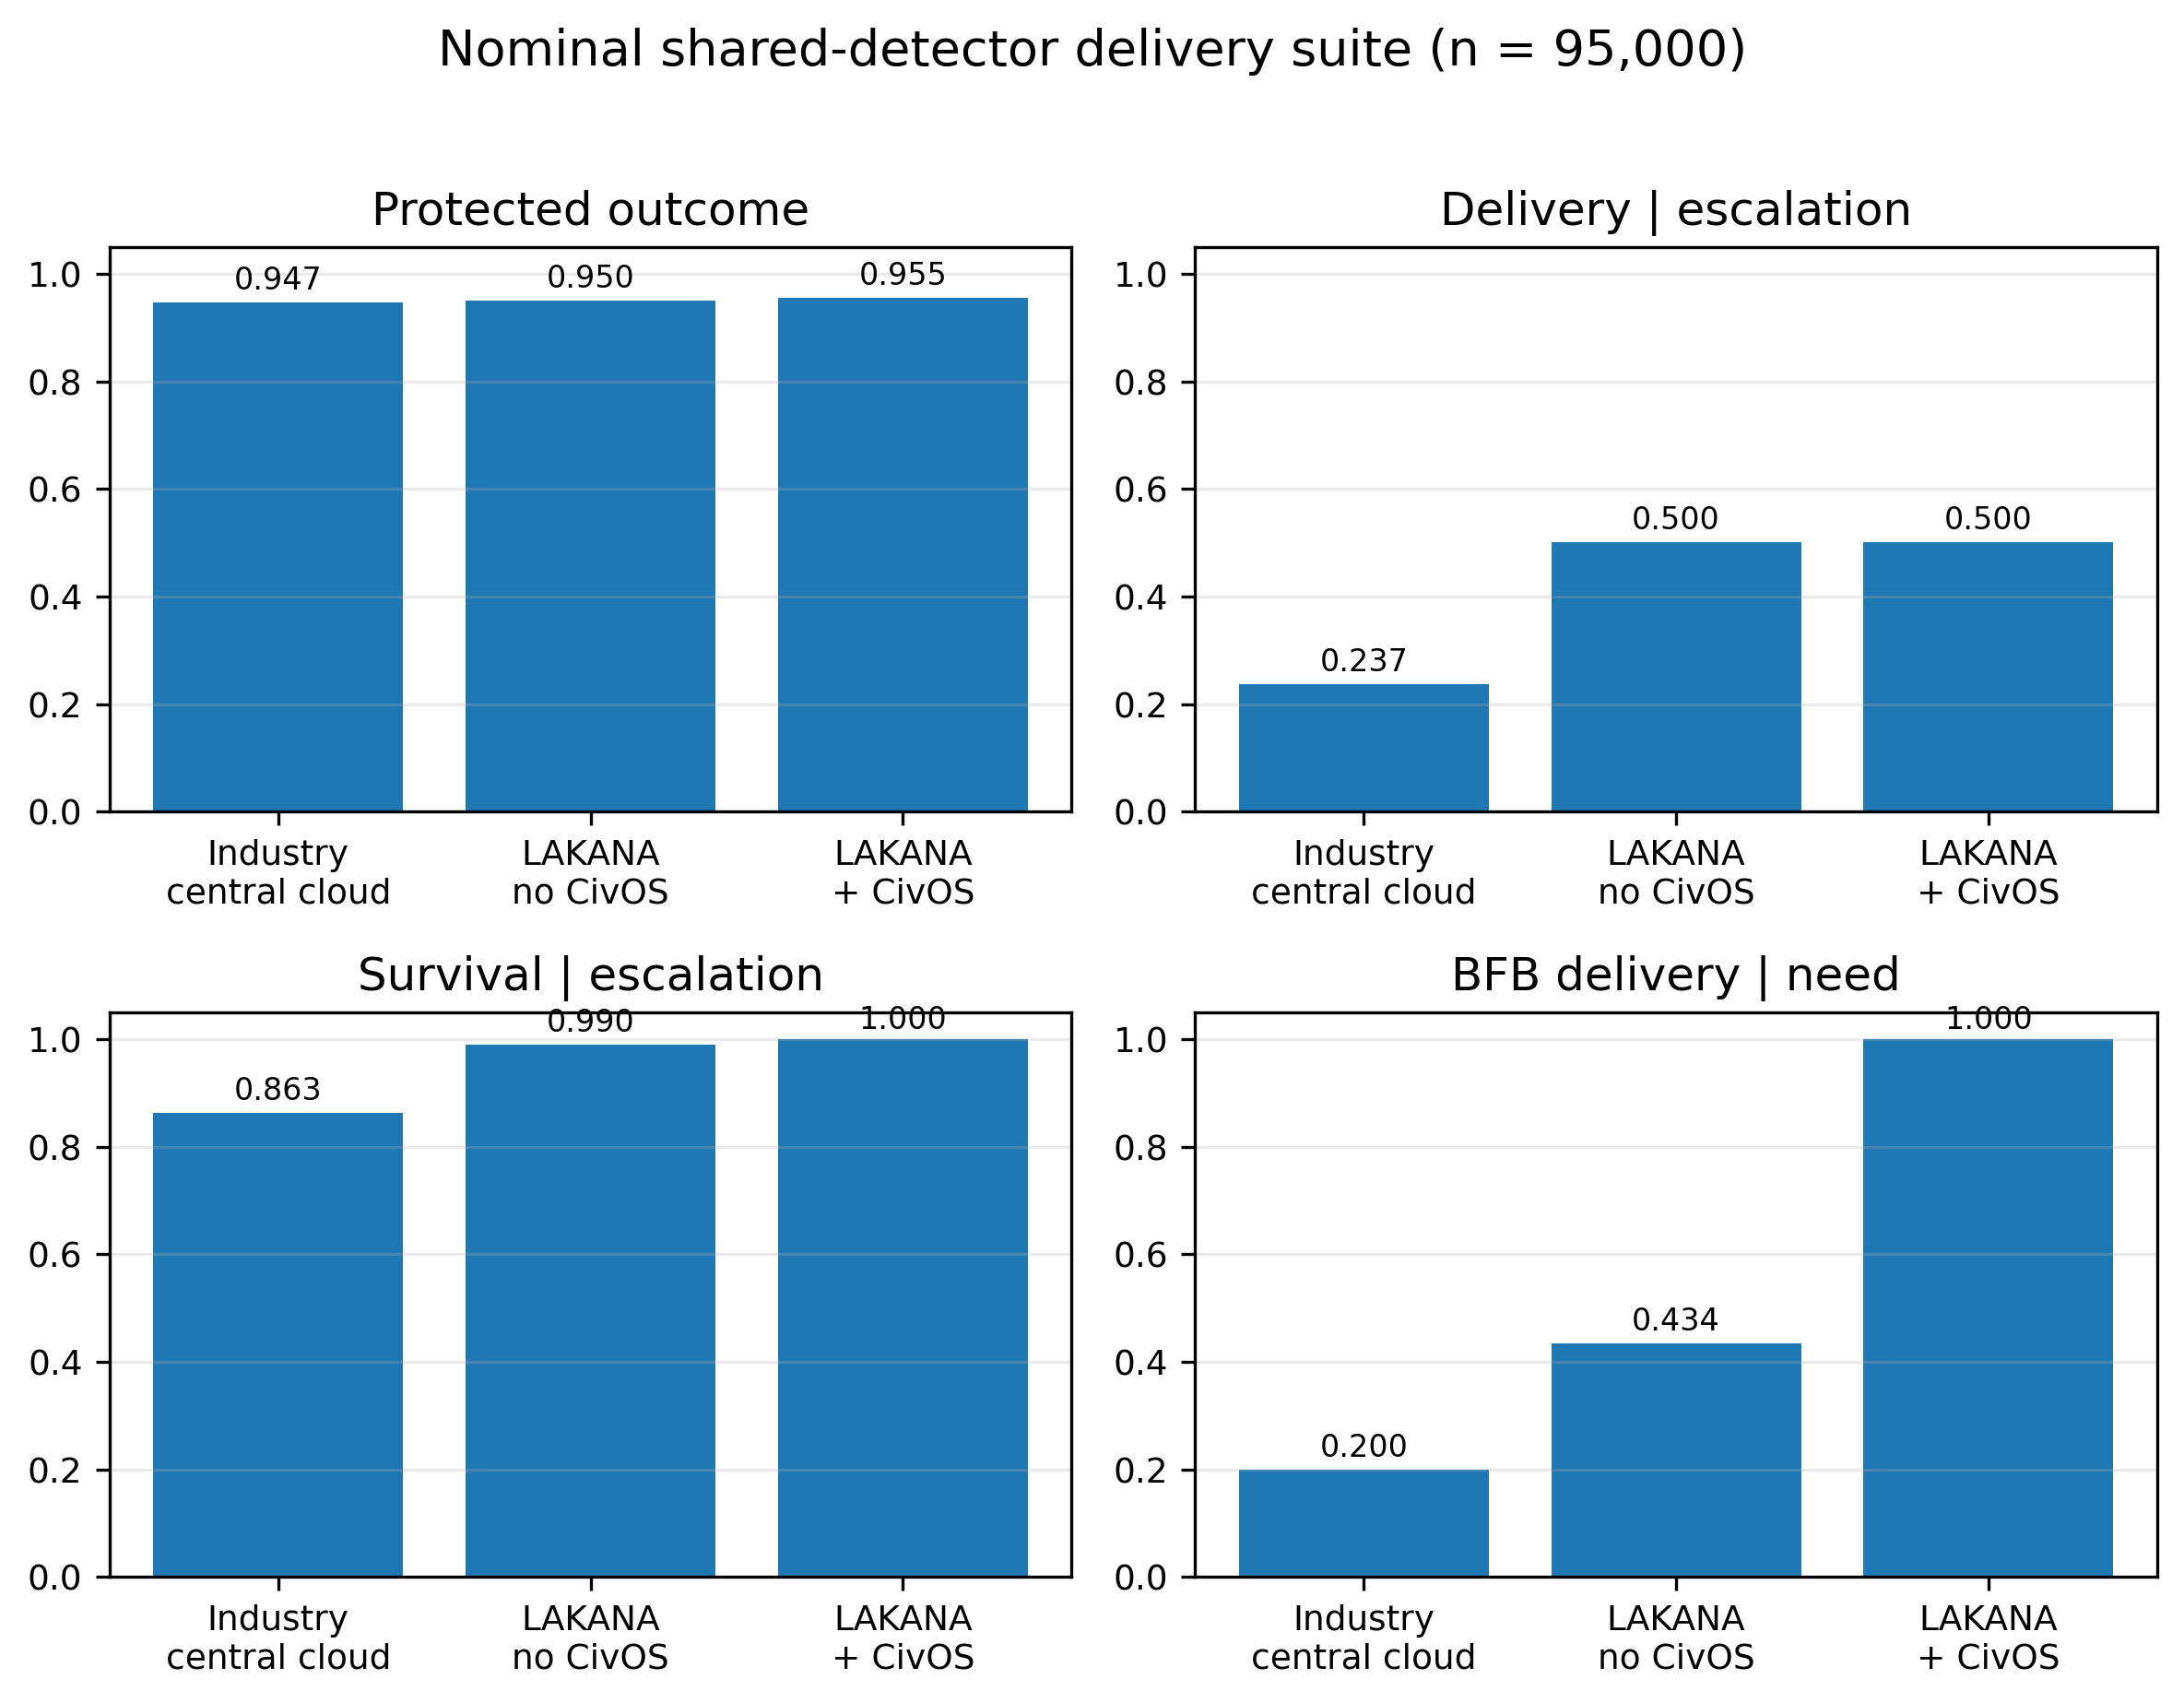
Figure 2 — Protected-Outcome Architecture Comparison

Protected-outcome architecture comparison with 95% Wilson confidence intervals (n = 250,000). LAKANA+CivOS: 0.954636 [0.953813, 0.955445]; LAKANA without CivOS: 0.949616 [0.948752, 0.950467]; industry central/cloud comparator: 0.947172 [0.946288, 0.948042]. This is reported as a separate protected-outcome metric, not as a replacement for the main safe-state survivability estimates.

Figure 3 — Nominal Shared-Detector Delivery Suite

Nominal shared-detector delivery suite (n = 95,000). Detector-side quantities are held constant across architectures. Panel A reports protected outcome. Panel B reports conditional delivery given escalation. Panel C reports conditional survival given escalation. Panel D reports BFB delivery given need. LAKANA+CivOS achieves conditional survival of 1.000 and BFB delivery of 1.000 versus approximately 0.863 and 0.200 for the industry comparator.

Figure 4 — Nominal Detector Tradespace

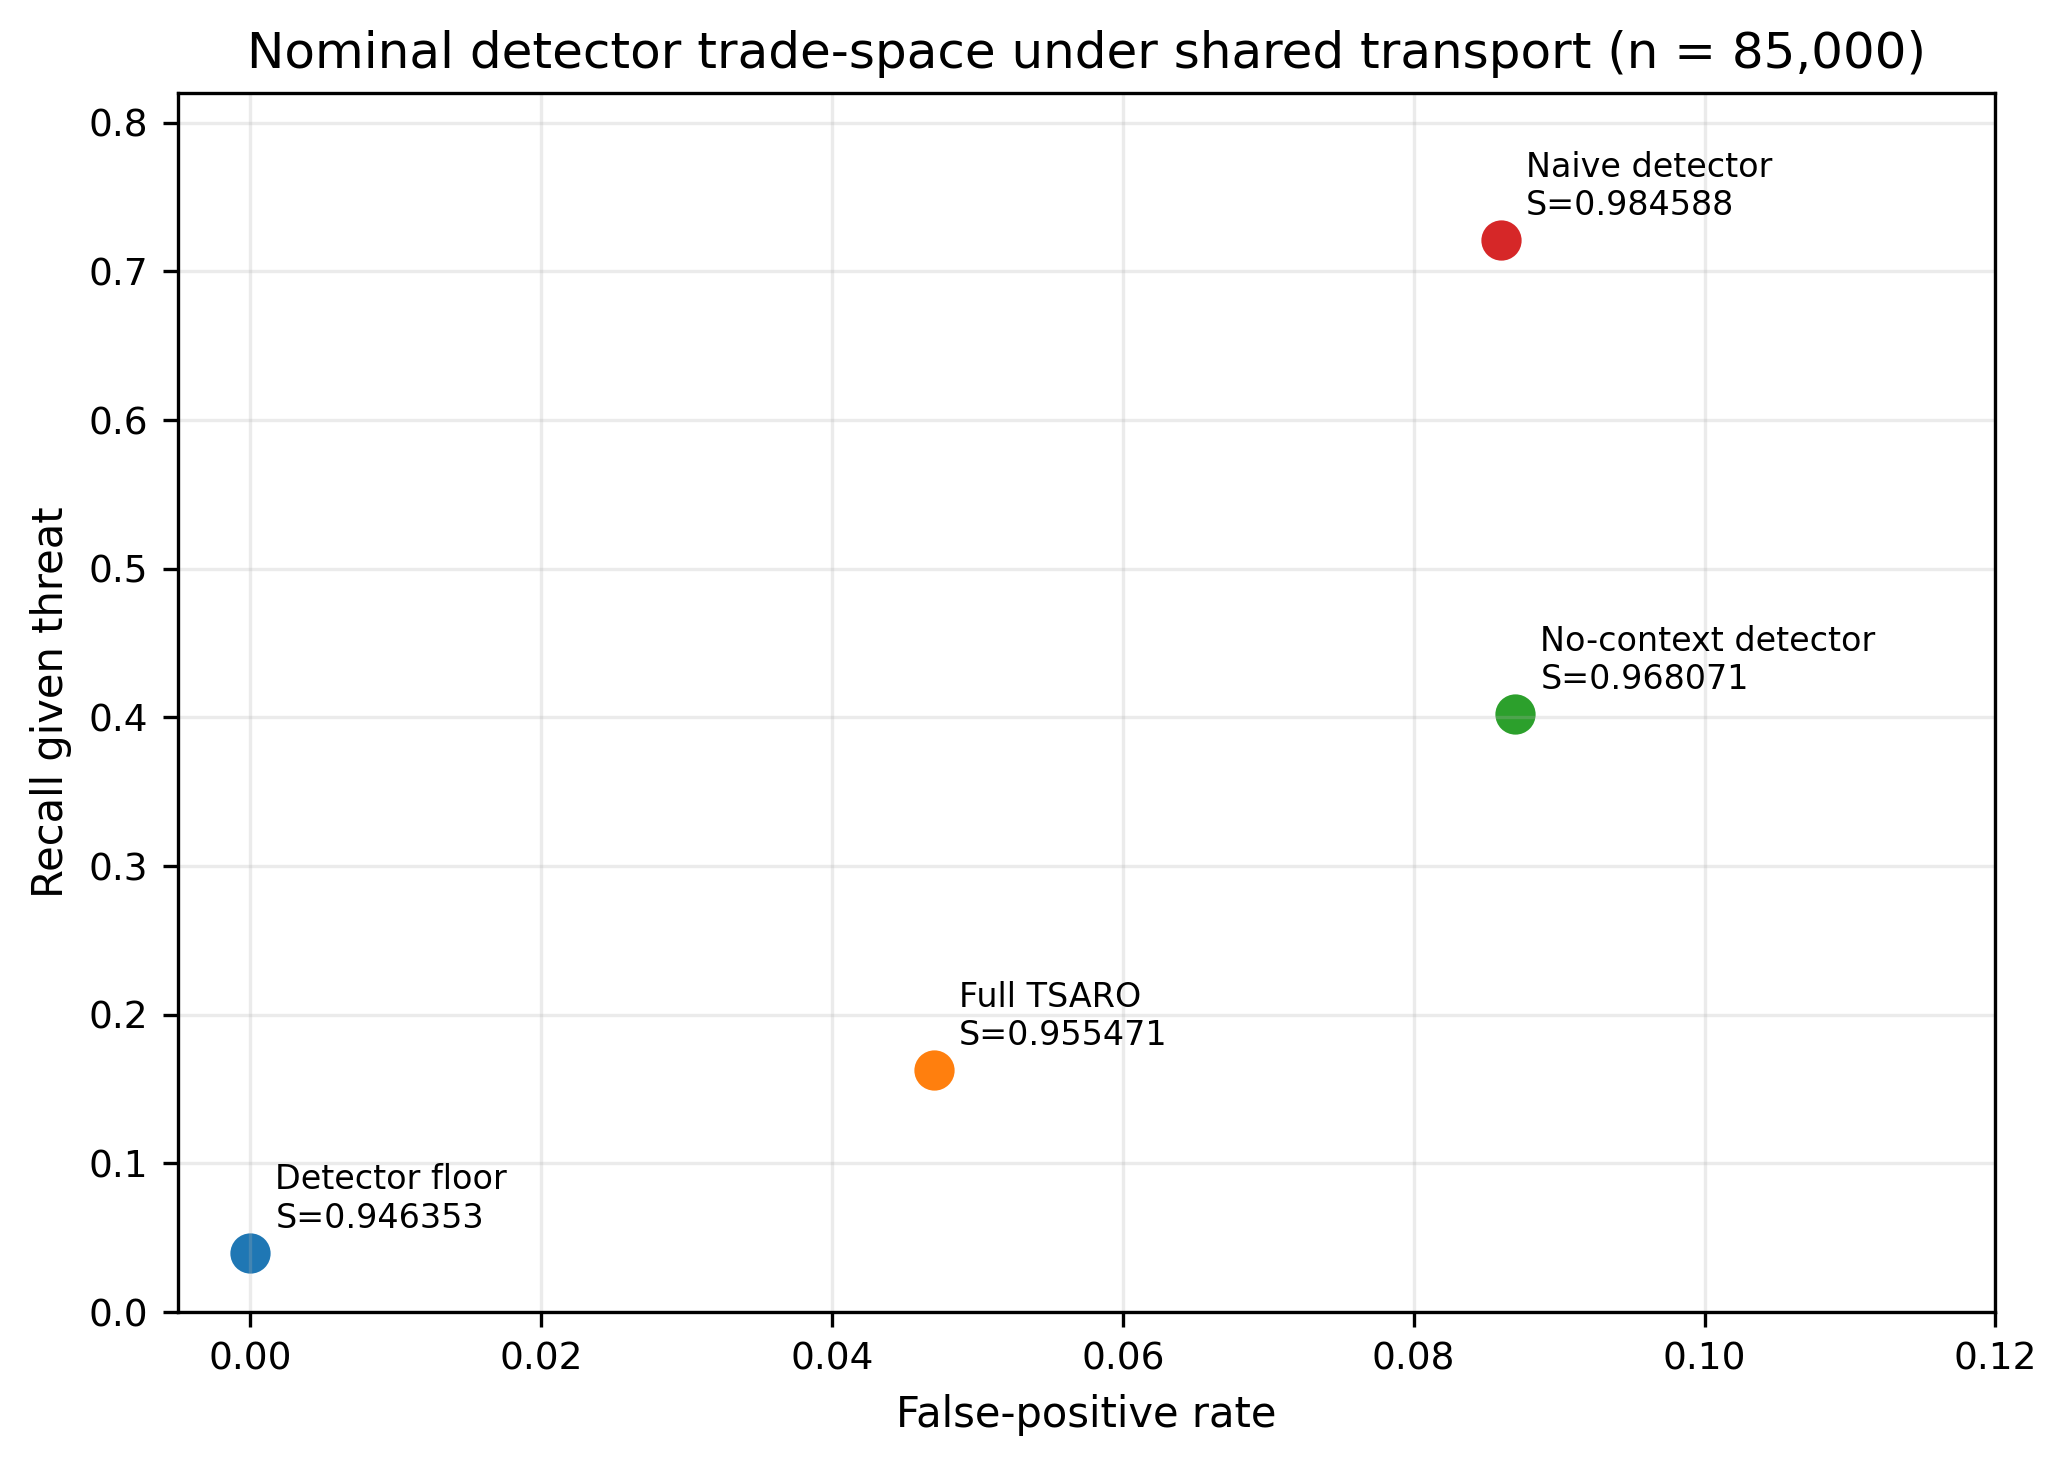
Nominal detector trade-space under shared transport (n = 85,000). The full TSARO detector reports FPR = 0.047, recall = 0.163, and survivability S = 0.955471. The naive detector reports FPR = 0.086, recall = 0.721, and S = 0.984588. This is a burden-sensitivity trade-space, not a detector-dominance claim: simpler detectors raise recall and survivability in this diagnostic but also impose escalation burden.

Figure 5 — Degraded Delivery Suite

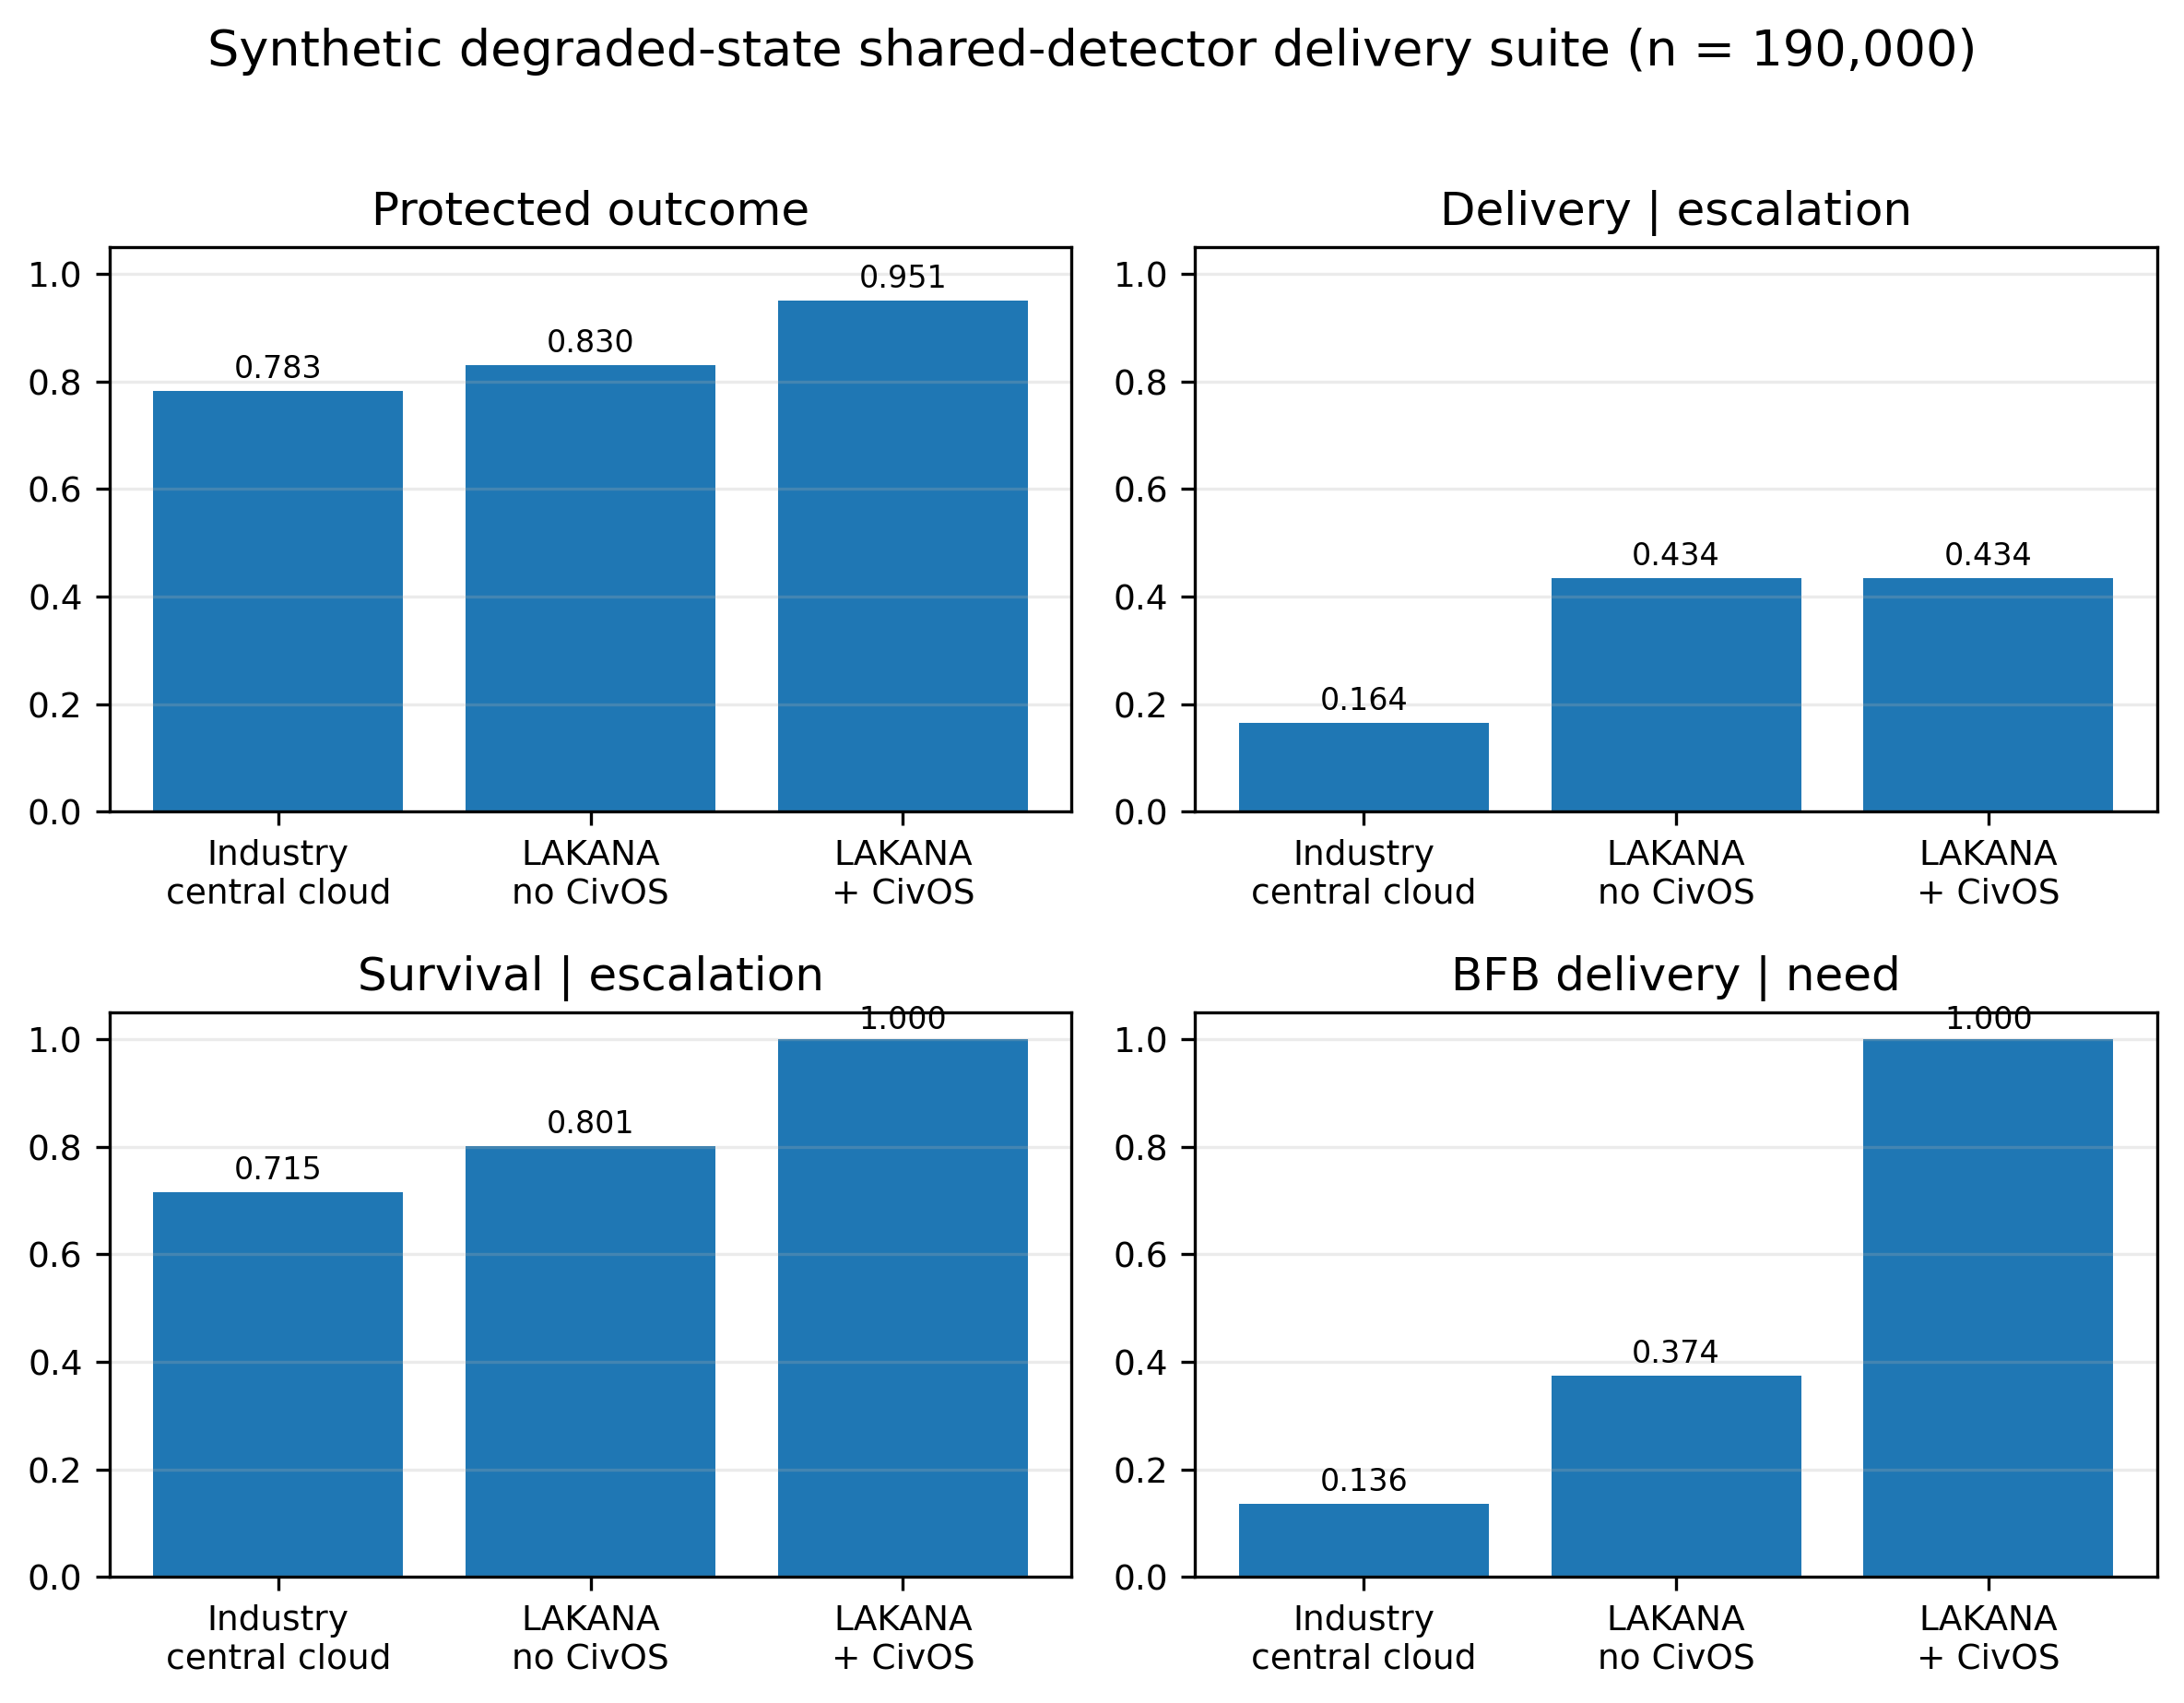
Synthetic degraded-state shared-detector delivery suite (n = 190,000). This stressed architecture comparison holds detector behavior fixed across arms. Under degraded-state stress, the industry-style centralized/cloud comparator's protected outcome falls to approximately 0.783, while LAKANA+CivOS maintains approximately 0.951. BFB delivery given need is 0.136 for the industry comparator versus 1.000 for LAKANA+CivOS. The comparator's dependence on centralized transport is the dominant failure mechanism in this diagnostic.

Figure 6 — Degraded Detector Tradespace

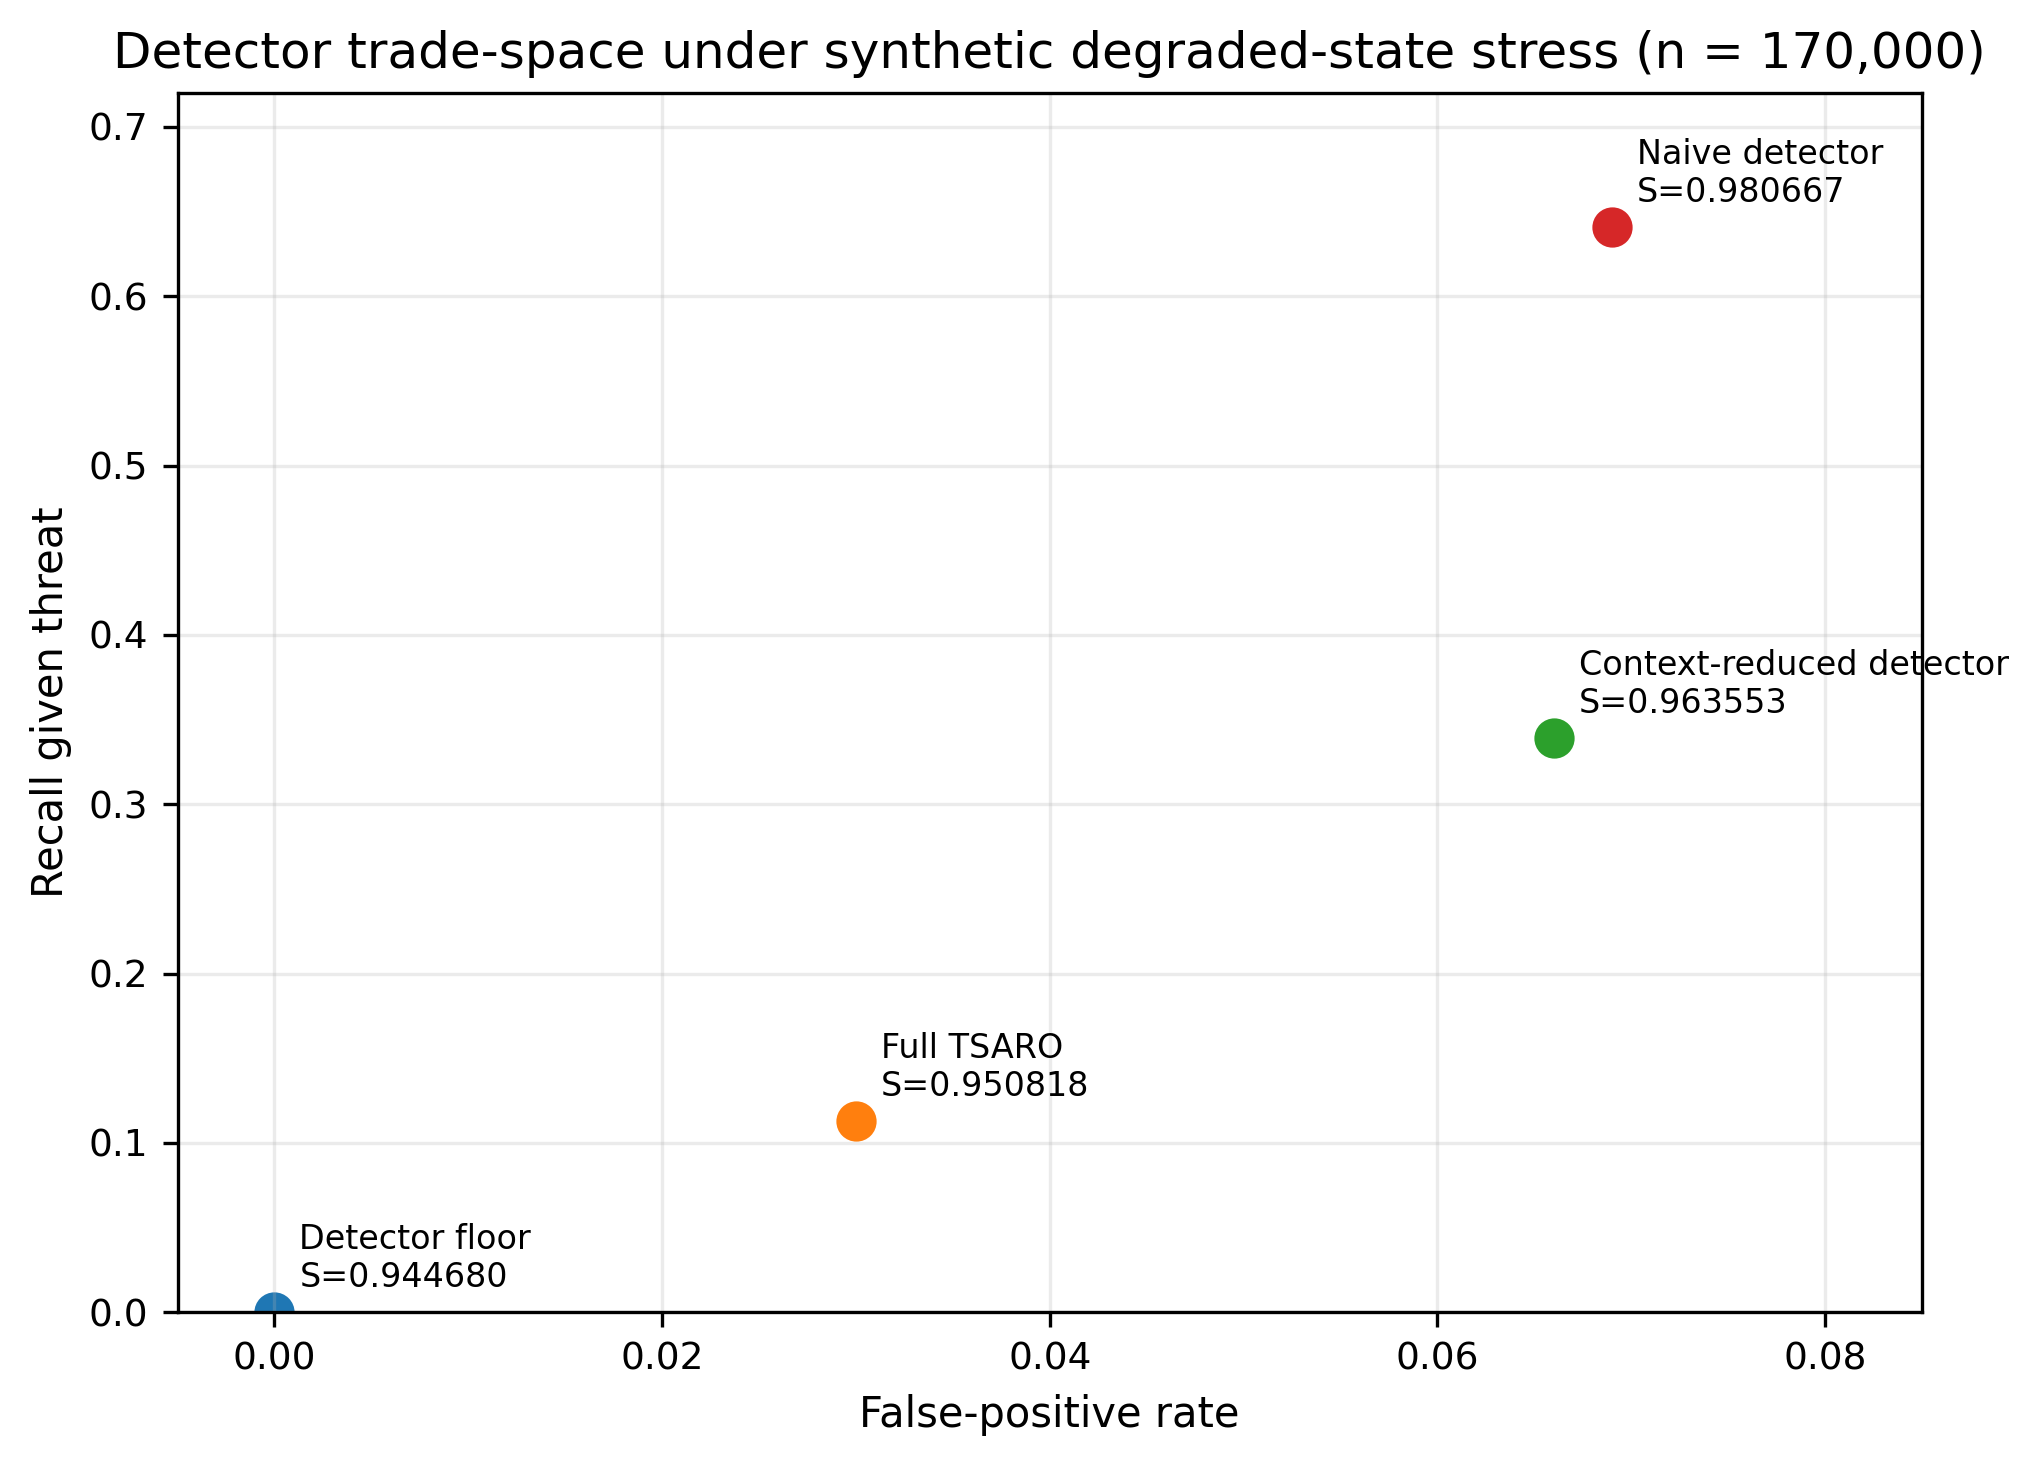
Detector trade-space under synthetic degraded-state stress (n = 170,000). The burden-sensitivity pattern persists under stressed infrastructure. Full detector: FPR = 0.030, recall = 0.113, S = 0.950818. Naive detector: FPR = 0.069, recall = 0.641, S = 0.980667. Shared transport is held fixed; simpler detectors raise recall and survivability while also raising false-positive burden.

Figure 7 — Grouped Degraded Outcomes

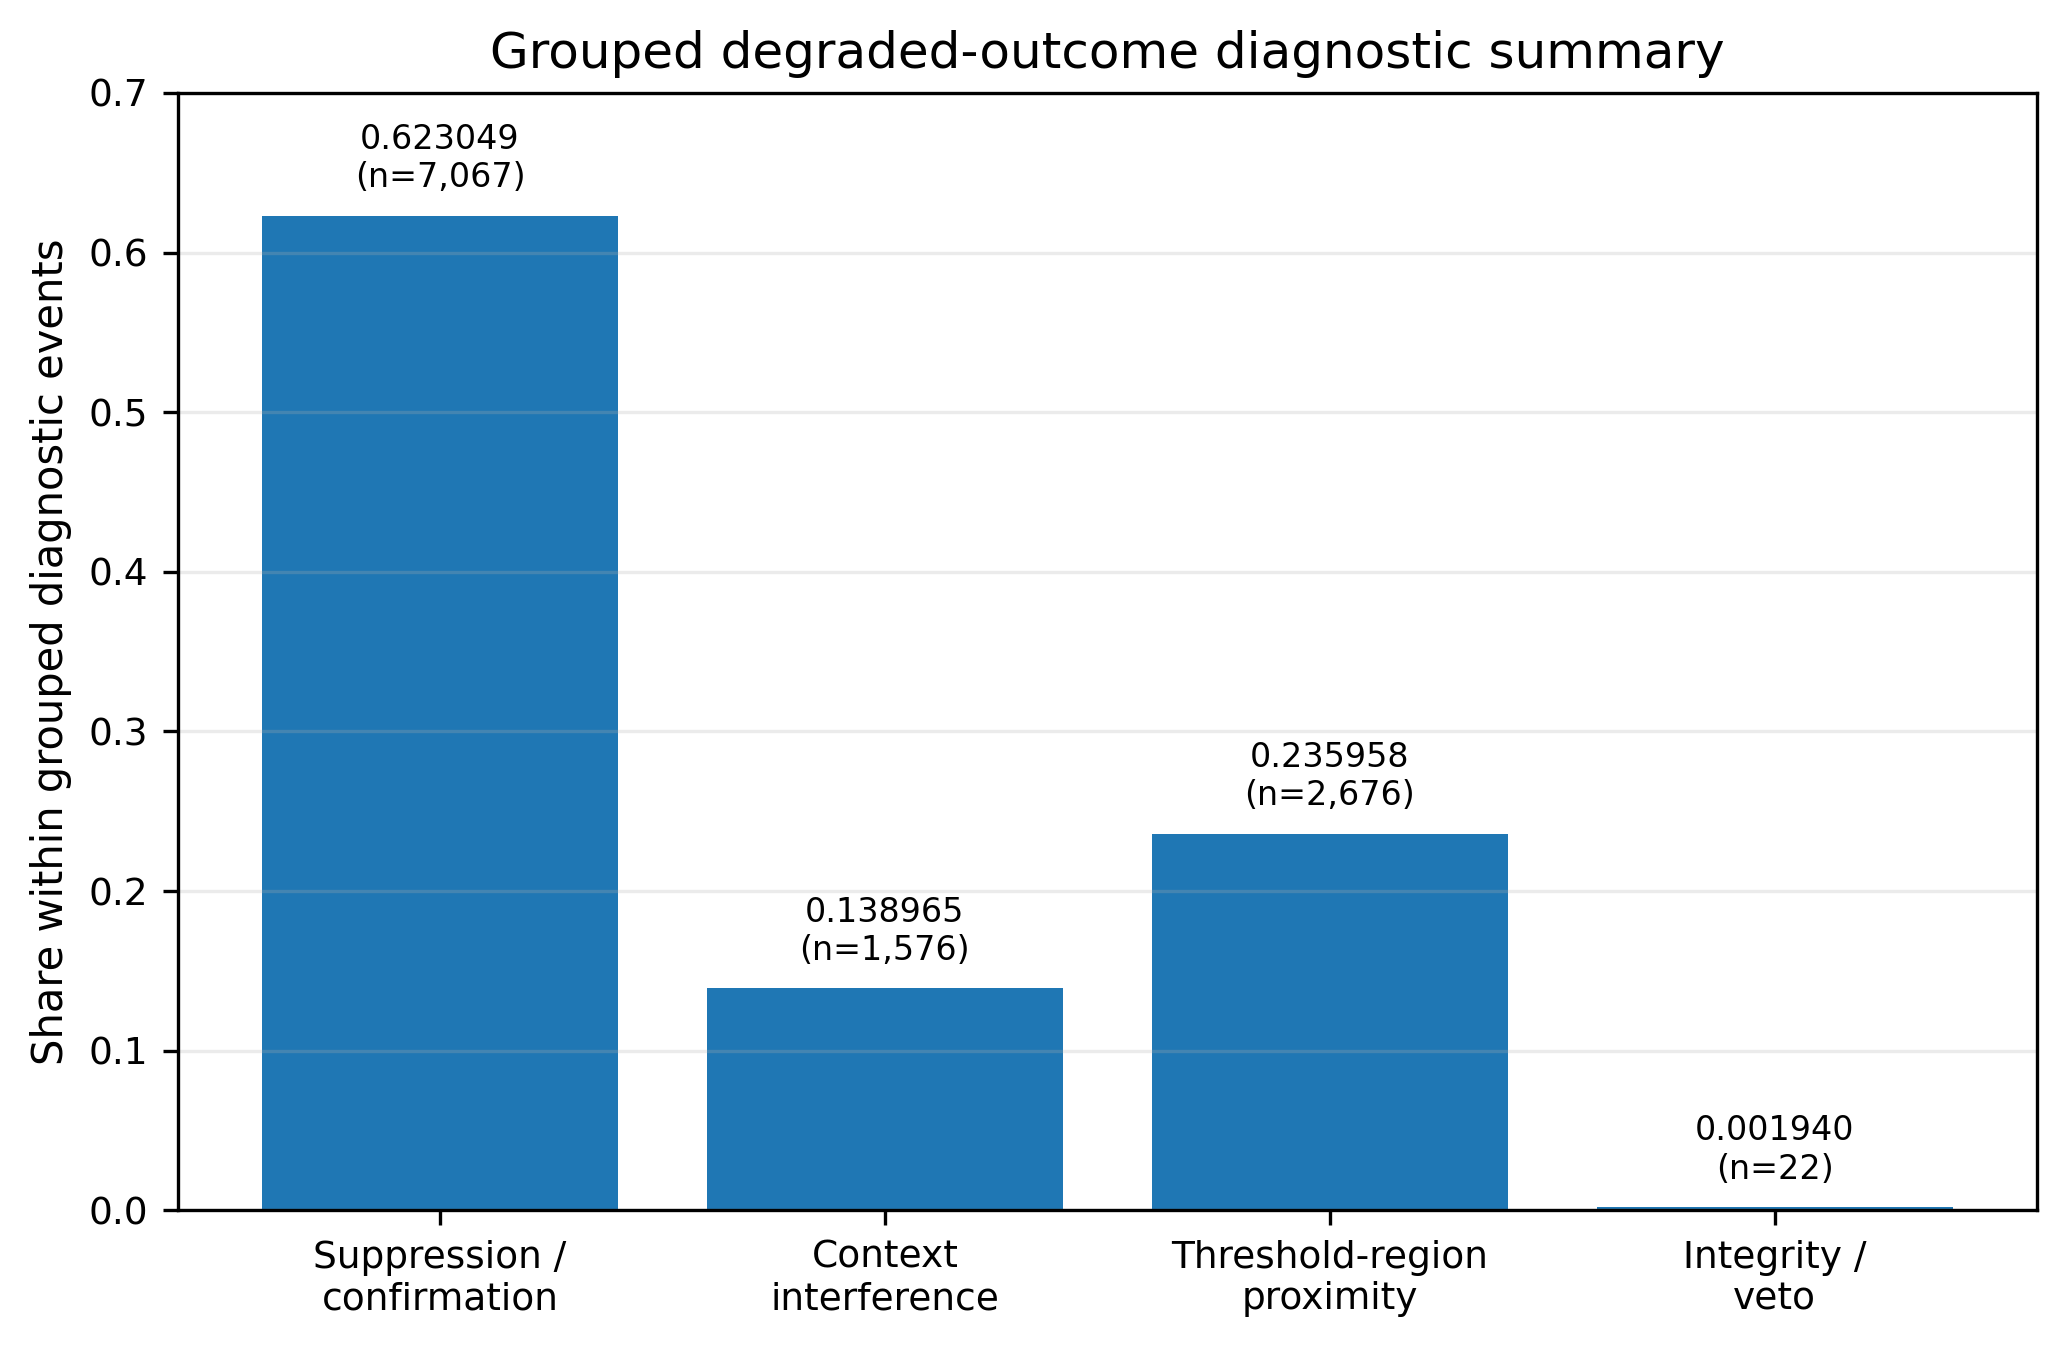
Grouped degraded-outcome diagnostic summary. Public-safe grouped diagnostic view for the nominal headline run. Suppression/confirmation accounts for 62.3% (n = 7,067) of grouped degraded-outcome events; threshold-region proximity accounts for 23.6% (n = 2,676); context interference accounts for 13.9% (n = 1,576); integrity/veto accounts for 0.19% (n = 22). Grouped diagnostics make degraded outcomes inspectable without exposing reconstructive internal taxonomy.

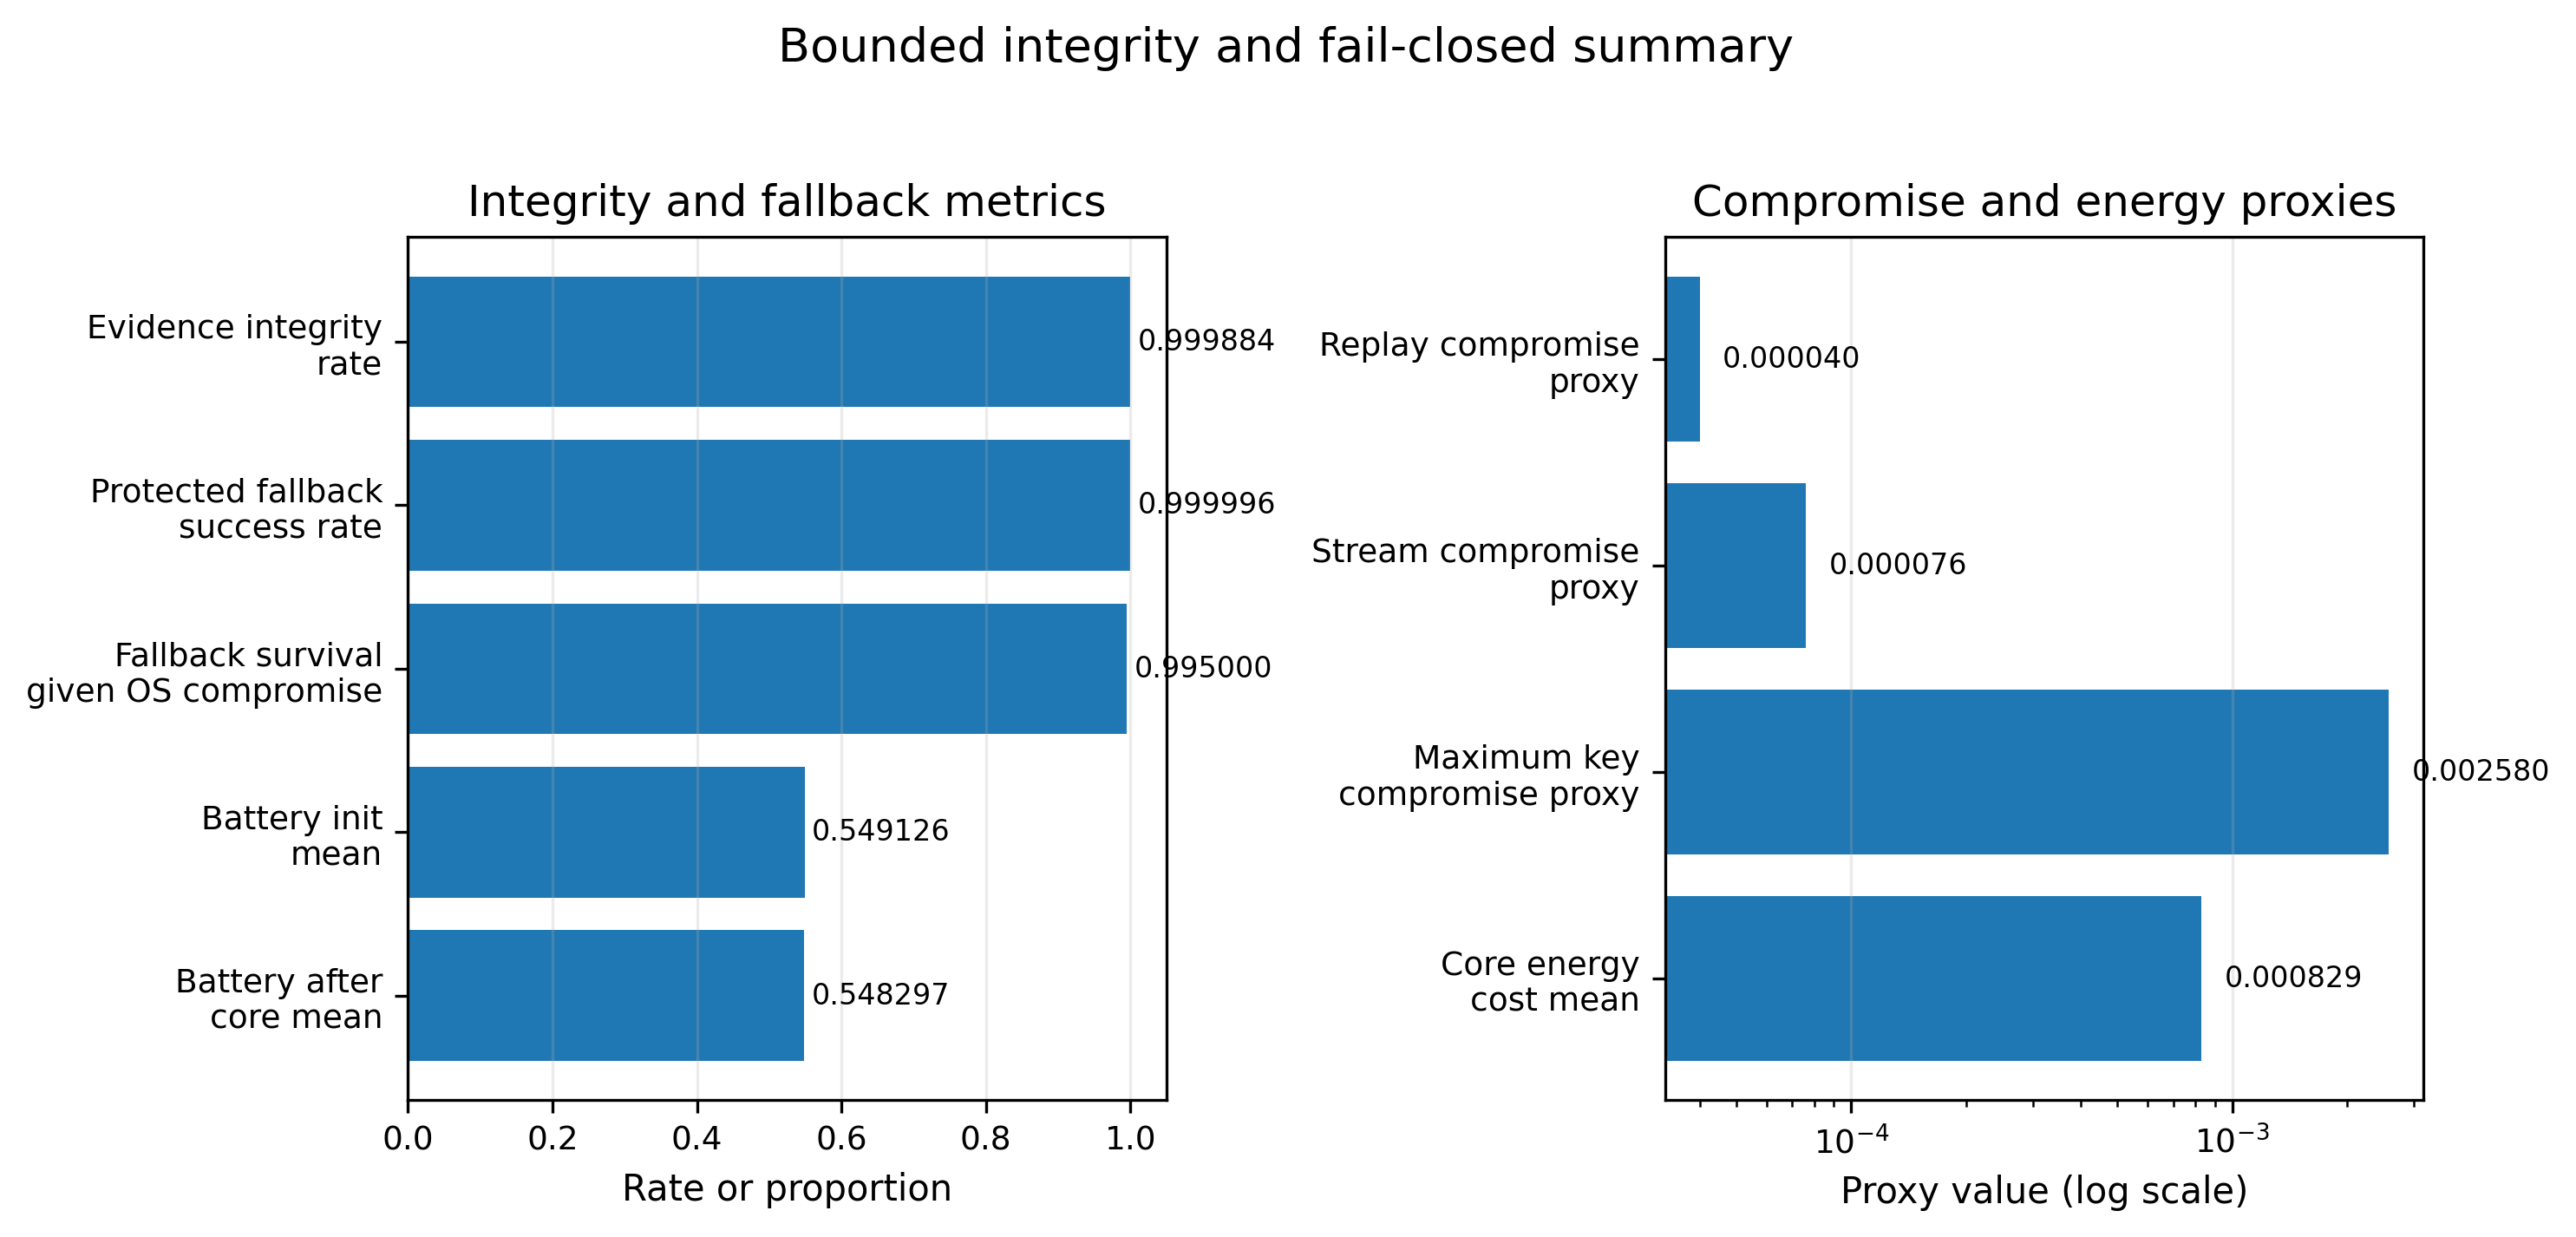
Figure 8 — Integrity and Fail-Closed Behavior

Bounded integrity and fail-closed summary. Panel A reports integrity and fallback metrics: evidence integrity rate 0.999884; protected fallback success rate 0.999996; fallback survival given OS compromise 0.995000. Panel B reports compromise and energy proxies on a log scale. These are simulator-internal consistency and fail-closed indicators, not hardware-validated field metrics.

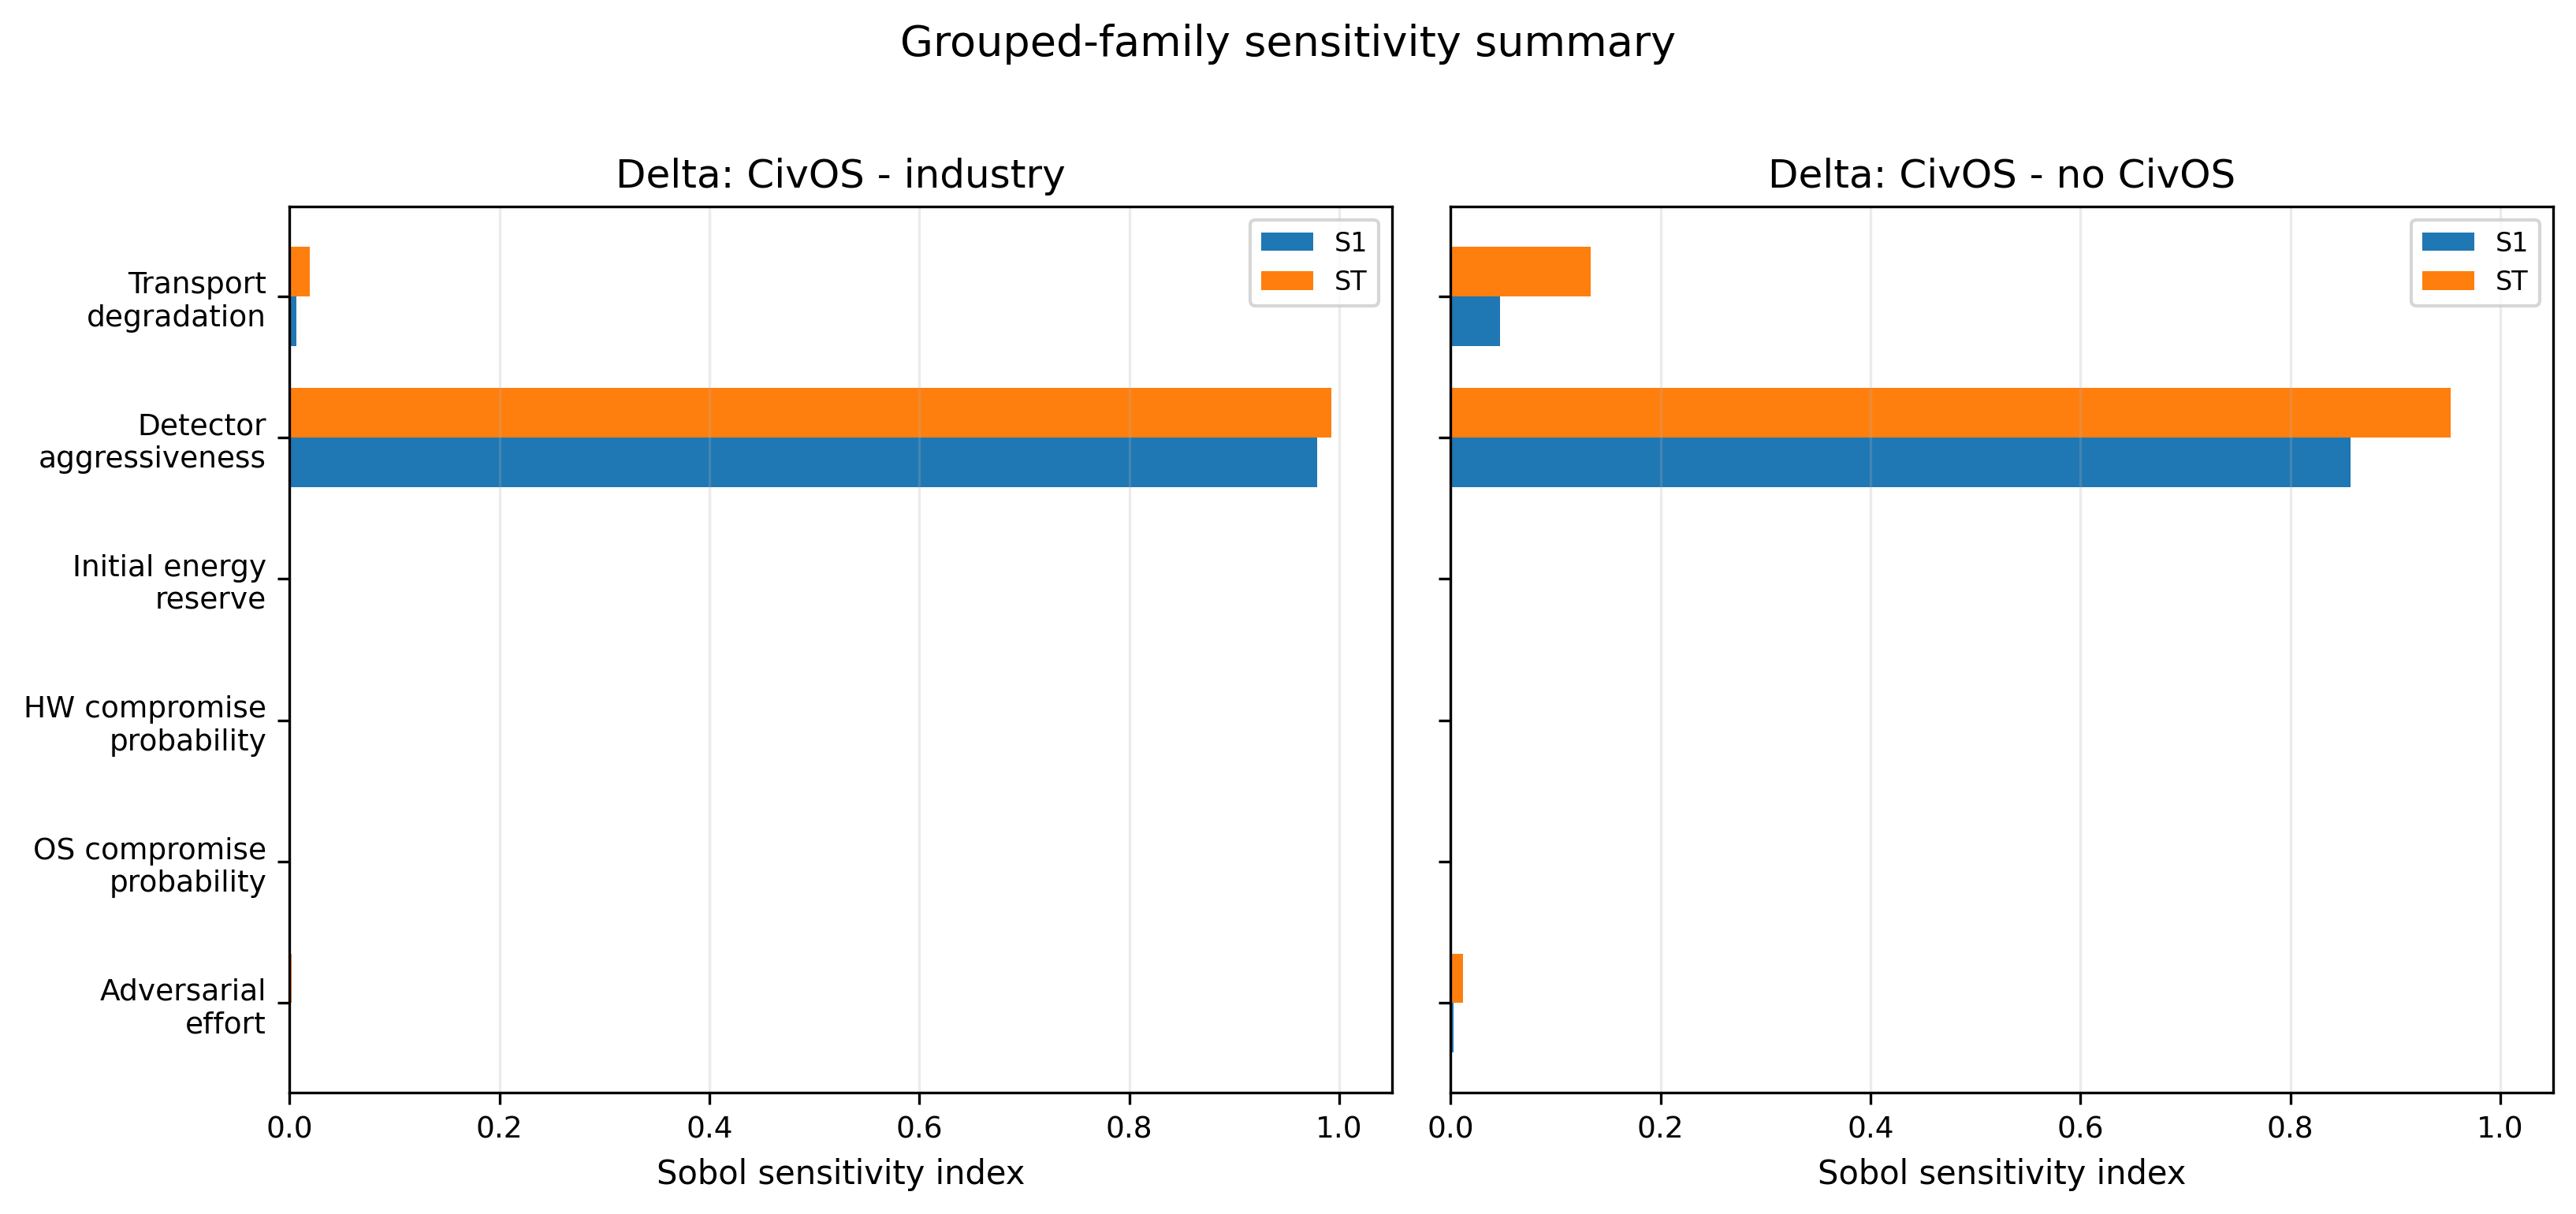
Figure 9 — Sensitivity Summary

Grouped-family Sobol sensitivity indices within the bounded six-parameter analysis box. Detector aggressiveness dominates first-order and total-order sensitivity, with transport degradation as a secondary contributor. OS compromise probability, hardware compromise probability, and initial energy reserve contribute negligibly within the bounded analysis box.

// 02 - claim boundary

Figure interpretation boundary

These figures visualize simulation outputs and architecture-level evidence. They are not clinical validation, field validation, production certification, emergency-response certification, privacy/security certification, or proof of guaranteed real-world effectiveness.